| << Back to previous view |
[QA-66] The autoupgrade utility looks for non-existent source service name on target server in the Hot-Cloning method Created: 06/Feb/25 Updated: 06/Feb/25 |
|
| Status: | Closed |
| Project: | Questions & Answers |
| Fix Version/s: | None |
| Type: | Oracle - Operating System | Priority: | Major |
| Reporter: | ubTools Support | Assignee: | ubTools Support |
| Resolution: | Answered | Votes: | 0 |
| File Attachments: |
|
| Product Version: | 24.8.241119 |
| Operating System: | Windows |
| Host Name: | . |
| Database Name: | . |
| Description |
|
PROBLEM:
Even though source database service name does not look required on target server in the Hot-Cloning (Unplug-Plug Relocate) method, the autoupgrade utility still looks for non-existent source service name on target server. This problem occurs when source database is a CDB or not. DATABASES:
CONFIGURATION: global.autoupg_log_dir=C:\oracle\app\Ora-Admin\cfgtoollogs\autoupgrade
upg1.manage_network_files=SKIP
upg1.sid=REPO
upg1.source_home=C:\oracle\product\12.2.0\dbhome_1
upg1.target_cdb=PRODCDB
upg1.target_home=C:\oracle\app\Ora-Admin\product\19.0.0\dbhome_1
upg1.target_pdb_copy_option.REPO=file_name_convert=('C:\ORACLE\ORADATA\', 'D:\ORACLE\ORADATA\PRODCDB\')
upg1.source_dblink.REPO=repo_link 600
upg1.start_time=30/01/2025 14:00:00
ERROR MESSAGE: DOS> %ORACLE_HOME%\jdk\bin\java -jar %ORACLE_HOME%\rdbms\admin\autoupgrade.jar -config REPO-autopgrade_config.txt -mode deploy AutoUpgrade 24.8.241119 launched with default internal options Processing config file ... There were conditions found preventing AutoUpgrade from successfully running *Windows Service Availability Windows service, OracleServiceREPO, does not exist DOS> |
| Comments |
| Comment by ubTools Support [ 06/Feb/25 02:42 PM ] |
WORKAROUND:
DOS> oradim -new -sid REPO
Instance created.

DOS>
The OracleVssWriter services are also disabled since They are not needed in the case.
DOS> oradim -delete -sid REPO Unable to stop service, OS Error = 1062 Instance deleted. DOS> |
[QA-60] "PRVF-5507 : NTP daemon or service is not running on any node ..." even if NTP is running. Created: 05/Mar/16 Updated: 05/Mar/16 |
|
| Status: | Closed |
| Project: | Questions & Answers |
| Fix Version/s: | None |
| Type: | Oracle - Operating System | Priority: | Major |
| Reporter: | ubTools Support | Assignee: | ubTools Support |
| Resolution: | Answered | Votes: | 0 |
| Product Version: | 11.2.0.4 RAC |
| Operating System: | Linux |
| Operating System Version: | Oracle Linux 7.2 |
| Host Name: | . |
| Database Name: | . |
| Description |
CVU gives the following error:
$./runcluvfy.sh stage -pre crsinst -n sygnx01,sygnx02 -verbose ..... No NTP Daemons or Services were found to be running PRVF-5507 : NTP daemon or service is not running on any node but NTP configuration file exists on the following node(s): sygnx02,sygnx01 Result: Clock synchronization check using Network Time Protocol(NTP) failed |
| Comments |
| Comment by ubTools Support [ 05/Mar/16 03:12 PM ] |
NTP status:
[root@sygnx01 ~]# systemctl status ntpd
 ntpd.service - Network Time Service
   Loaded: loaded (/usr/lib/systemd/system/ntpd.service; enabled; vendor preset: disabled)
   Active: active (running) since Sat 2016-03-05 14:32:46 EET; 1h 29min ago
  Process: 1074 ExecStart=/usr/sbin/ntpd -u ntp:ntp $OPTIONS (code=exited, status=0/SUCCESS)
 Main PID: 1081 (ntpd)
   CGroup: /system.slice/ntpd.service
           1081 /usr/sbin/ntpd -u ntp:ntp -x -g
NTP is running. |
| Comment by ubTools Support [ 05/Mar/16 03:17 PM ] |
|
CVU Trace:
Generating Trace: $ export CV_TRACELOC=/tmp $ export SRVM_TRACE=true $ ./runcluvfy.sh stage -pre crsinst -n sygnx01,sygnx02 -verbose ..... Excerpt from the trace: [20421@***.***.com] [Worker 0] [ 2016-03-05 16:20:46.657 EET ] [RuntimeExec.runCommand:77] /tmp/CVU_11.2.0.4.0_grid/exectask.sh -chkfile /var/run/ntpd.pid [20421@***.***.com] [Worker 0] [ 2016-03-05 16:20:46.659 EET ] [RuntimeExec.runCommand:142] runCommand: Waiting for the process [20421@***.***.com] [Thread-216] [ 2016-03-05 16:20:46.659 EET ] [StreamReader.run:61] In StreamReader.run [20421@***.***.com] [Thread-217] [ 2016-03-05 16:20:46.659 EET ] [StreamReader.run:61] In StreamReader.run [20421@***.***.com] [Thread-216] [ 2016-03-05 16:20:46.668 EET ] [StreamReader.run:65] OUTPUT><CV_VRES>1</CV_VRES><CV_LOG>Exectask: file check failed</CV_LOG><CV_ERES>0</CV_ERES> ..... [20421@sygnx01.sankomenkul.com] [main] [ 2016-03-05 16:20:46.669 EET ] [TaskDaemonLiveliness.displayDaemonLivelinessOutput:283] Daemon 'ntpd' is not running on node: 'sygnx01' "/var/run/ntpd.pid" doesn't exist. |
| Comment by ubTools Support [ 05/Mar/16 03:22 PM ] |
|
Solution
There was no "/var/run/ntpd.pid" file defined in "/etc/sysconfig/ntpd". The problem has been solved after setting as below: #OPTIONS="-g" OPTIONS="-x -g -p /var/run/ntpd.pid" Additional note: NTP has been replaced by Chrony(new feature) in Oracle Linux 7. Ref: Oracle Note: Unable to Configure NTP after Oracle Linux 7 Installation (Doc ID 1995703.1) |
[QA-59] Unable to use the full CPU speed when CPUfreq Governor is ondemand. Created: 29/Sep/15 Updated: 02/Oct/15 |
|
| Status: | Closed |
| Project: | Questions & Answers |
| Fix Version/s: | None |
| Type: | Oracle - Operating System | Priority: | Major |
| Reporter: | ubTools Support | Assignee: | ubTools Support |
| Resolution: | Answered | Votes: | 0 |
| File Attachments: |
|
| Product Version: | 11.2.0.3 |
| Operating System: | Linux |
| Operating System Version: | 2.6.32-504.23.4.el6.x86_64 |
| Host Name: | . |
| Database Name: | . |
| Description |
|
The customer is unable use the full CPU speed. The CPUfreq Governor is OnDemand.
|
| Comments |
| Comment by ubTools Support [ 29/Sep/15 12:16 PM ] | ||||||||||||||||
| See the following notes for the basic definitions of CPUfreq Governors: | ||||||||||||||||
| Comment by ubTools Support [ 29/Sep/15 12:21 PM ] | ||||||||||||||||
|
ENVIRONMENT:
Data: [perftest1]/sys/devices/system/cpu/cpu0/cpufreq $ more * :::::::::::::: affected_cpus :::::::::::::: 0 cpuinfo_cur_freq: Permission denied :::::::::::::: cpuinfo_max_freq :::::::::::::: 2000000 :::::::::::::: cpuinfo_min_freq :::::::::::::: 1200000 :::::::::::::: cpuinfo_transition_latency :::::::::::::: 10000 *** ondemand: directory *** :::::::::::::: related_cpus :::::::::::::: 0 :::::::::::::: scaling_available_frequencies :::::::::::::: 2000000 1900000 1800000 1700000 1600000 1500000 1400000 1300000 1200000 :::::::::::::: scaling_available_governors :::::::::::::: ondemand userspace performance :::::::::::::: scaling_cur_freq :::::::::::::: 2000000 :::::::::::::: scaling_driver :::::::::::::: acpi-cpufreq :::::::::::::: scaling_governor :::::::::::::: ondemand :::::::::::::: scaling_max_freq :::::::::::::: 2000000 :::::::::::::: scaling_min_freq :::::::::::::: 1200000 :::::::::::::: scaling_setspeed :::::::::::::: <unsupported> *** stats: directory *** [perftest1]/sys/devices/system/cpu/cpu0/cpufreq $ cd ondemand [perftest1]/sys/devices/system/cpu/cpu0/cpufreq/ondemand $ ls -ltr total 0 -r--r--r-- 1 root root 4096 Sep 29 15:17 sampling_rate_min -r--r--r-- 1 root root 4096 Sep 29 15:17 sampling_rate_max -rw-r--r-- 1 root root 4096 Sep 29 15:17 up_threshold -rw-r--r-- 1 root root 4096 Sep 29 15:17 sampling_rate -rw-r--r-- 1 root root 4096 Sep 29 15:17 powersave_bias -rw-r--r-- 1 root root 4096 Sep 29 15:17 ignore_nice_load [perftest1]/sys/devices/system/cpu/cpu0/cpufreq/ondemand $ more * :::::::::::::: ignore_nice_load :::::::::::::: 0 :::::::::::::: powersave_bias :::::::::::::: 0 :::::::::::::: sampling_rate :::::::::::::: 10000 :::::::::::::: sampling_rate_max :::::::::::::: 4294967295 :::::::::::::: sampling_rate_min :::::::::::::: 10000 :::::::::::::: up_threshold :::::::::::::: 95 [perftest1]/sys/devices/system/cpu/cpu0/cpufreq/ondemand $ View:
| ||||||||||||||||
| Comment by ubTools Support [ 29/Sep/15 12:24 PM ] | ||||||||||||||||
|
atop(http://www.atoptool.nl/ From the man page of atop: In case that the kernel module 'cpufreq_stats' is active (after issueing 'modprobe cpufreq_stats'), the average frequency ('avgf')
and the average scaling percentage ('avgscal') is shown. Otherwise the current frequency ('curf') and the current scaling percentage
('curscal') is shown at the moment that the sample is taken.
In order to compare the CPU usages to the frequencies, CPU "cpufreq_stats" should be enabled. Otherwise, atop will show the current frequencies, not the average during monitoring samples. | ||||||||||||||||
| Comment by ubTools Support [ 29/Sep/15 12:29 PM ] | ||||||||||||||||
METHOD:
| ||||||||||||||||
| Comment by ubTools Support [ 29/Sep/15 12:57 PM ] | ||||||||||||||||
|
TEST1:
CPU scaling governor is ondemand. An atop snapshot: ATOP - avsprddbflx05 2015/09/29 15:40:21 --------- 10s elapsed PRC | sys 7.86s | user 80.03s | #proc 1347 | #tslpi 1791 | #tslpu 0 | #zombie 0 | no procacct | CPU | sys 66% | user 800% | irq 13% | idle 626% | wait 95% | avgf 1.63GHz | avgscal 81% | cpu | sys 4% | user 86% | irq 1% | idle 6% | cpu000 w 3% | avgf 1.94GHz | avgscal 96% | cpu | sys 4% | user 77% | irq 5% | idle 11% | cpu004 w 3% | avgf 1.90GHz | avgscal 94% | cpu | sys 4% | user 72% | irq 0% | idle 17% | cpu001 w 7% | avgf 1.83GHz | avgscal 91% | cpu | sys 3% | user 67% | irq 0% | idle 20% | cpu002 w 9% | avgf 1.80GHz | avgscal 90% | cpu | sys 3% | user 61% | irq 0% | idle 28% | cpu003 w 8% | avgf 1.73GHz | avgscal 86% | cpu | sys 6% | user 54% | irq 1% | idle 34% | cpu009 w 6% | avgf 1.62GHz | avgscal 80% | cpu | sys 3% | user 52% | irq 1% | idle 36% | cpu005 w 8% | avgf 1.68GHz | avgscal 83% | cpu | sys 7% | user 47% | irq 1% | idle 29% | cpu008 w 16% | avgf 1.67GHz | avgscal 83% | cpu | sys 6% | user 45% | irq 0% | idle 48% | cpu013 w 1% | avgf 1.52GHz | avgscal 76% | cpu | sys 7% | user 39% | irq 1% | idle 53% | cpu015 w 1% | avgf 1.49GHz | avgscal 74% | cpu | sys 3% | user 41% | irq 0% | idle 49% | cpu006 w 7% | avgf 1.57GHz | avgscal 78% | cpu | sys 5% | user 34% | irq 0% | idle 52% | cpu010 w 9% | avgf 1.51GHz | avgscal 75% | cpu | sys 2% | user 35% | irq 1% | idle 55% | cpu007 w 7% | avgf 1.55GHz | avgscal 77% | cpu | sys 4% | user 32% | irq 0% | idle 63% | cpu014 w 1% | avgf 1.43GHz | avgscal 71% | cpu | sys 4% | user 31% | irq 0% | idle 59% | cpu011 w 6% | avgf 1.46GHz | avgscal 72% | cpu | sys 2% | user 26% | irq 0% | idle 68% | cpu012 w 3% | avgf 1.43GHz | avgscal 71% | CPL | avg1 5.33 | avg5 5.46 | avg15 4.57 | csw 377039 | intr 323539 | | numcpu 16 | MEM | tot 126.1G | free 38.8G | cache 3.6G | dirty 4.0M | buff 146.3M | slab 577.8M | | SWP | tot 17.1G | free 17.1G | | | | vmcom 12.9G | vmlim 42.6G | NET | transport | tcpi 20869 | tcpo 21016 | udpi 70875 | udpo 71067 | tcpao 33 | tcppo 1 | NET | network | ipi 128214 | ipo 92084 | ipfrw 0 | deliv 91742 | icmpi 0 | icmpo 0 | PID TID SYSCPU USRCPU VGROW RGROW RUID EUID THR ST EXC S CPU CMD 1/64 13661 - 0.15s 4.50s -24.0M -14.3M grid oracle 1 -- - R 47% oracle 15747 - 0.16s 3.80s 0K 684K grid oracle 1 -- - S 40% oracle 13733 - 0.32s 3.57s 32768K 31360K grid oracle 1 -- - R 39% oracle 27274 - 0.61s 3.21s 24576K 11976K grid oracle 1 -- - R 39% oracle 14869 - 0.17s 3.29s 0K -1880K grid oracle 1 -- - S 35% oracle The "CPU" shows overall statistics for all CPUs. Analysis:
| ||||||||||||||||
| Comment by ubTools Support [ 29/Sep/15 01:22 PM ] | ||||||||||||||||
|
TEST2:
CPU scaling governor is performance. An atop snapshot: ATOP - avsprddbflx05 2015/09/29 16:16:27 --------- 10s elapsed PRC | sys 7.06s | user 86.40s | #proc 1313 | #tslpi 1756 | #tslpu 0 | #zombie 0 | no procacct | CPU | sys 57% | user 864% | irq 14% | idle 623% | wait 43% | avgf 2.00GHz | avgscal 100% | cpu | sys 3% | user 80% | irq 7% | idle 10% | cpu004 w 1% | avgf 2.00GHz | avgscal 100% | cpu | sys 5% | user 81% | irq 2% | idle 11% | cpu000 w 2% | avgf 2.00GHz | avgscal 100% | cpu | sys 3% | user 82% | irq 1% | idle 14% | cpu001 w 1% | avgf 2.00GHz | avgscal 100% | cpu | sys 3% | user 74% | irq 0% | idle 21% | cpu002 w 2% | avgf 2.00GHz | avgscal 100% | cpu | sys 3% | user 73% | irq 0% | idle 22% | cpu003 w 2% | avgf 2.00GHz | avgscal 100% | cpu | sys 3% | user 62% | irq 0% | idle 32% | cpu005 w 3% | avgf 2.00GHz | avgscal 100% | cpu | sys 6% | user 58% | irq 1% | idle 26% | cpu008 w 10% | avgf 2.00GHz | avgscal 100% | cpu | sys 3% | user 51% | irq 0% | idle 43% | cpu006 w 2% | avgf 2.00GHz | avgscal 100% | cpu | sys 3% | user 47% | irq 0% | idle 47% | cpu010 w 3% | avgf 2.00GHz | avgscal 100% | cpu | sys 3% | user 46% | irq 0% | idle 49% | cpu013 w 2% | avgf 2.00GHz | avgscal 100% | cpu | sys 2% | user 44% | irq 1% | idle 50% | cpu007 w 3% | avgf 2.00GHz | avgscal 100% | cpu | sys 6% | user 40% | irq 1% | idle 48% | cpu009 w 6% | avgf 2.00GHz | avgscal 100% | cpu | sys 6% | user 33% | irq 1% | idle 57% | cpu011 w 3% | avgf 2.00GHz | avgscal 100% | cpu | sys 2% | user 34% | irq 0% | idle 60% | cpu012 w 3% | avgf 2.00GHz | avgscal 100% | cpu | sys 4% | user 28% | irq 0% | idle 66% | cpu014 w 2% | avgf 2.00GHz | avgscal 100% | cpu | sys 2% | user 28% | irq 0% | idle 69% | cpu015 w 1% | avgf 2.00GHz | avgscal 100% | CPL | avg1 5.98 | avg5 6.41 | avg15 4.75 | csw 382133 | intr 340254 | | numcpu 16 | MEM | tot 126.1G | free 36.6G | cache 5.3G | dirty 28.9M | buff 193.0M | slab 836.2M | | SWP | tot 17.1G | free 17.1G | | | | vmcom 13.0G | vmlim 42.6G | NET | transport | tcpi 10272 | tcpo 10302 | udpi 75222 | udpo 75458 | tcpao 30 | tcppo 2 | NET | network | ipi 111030 | ipo 85760 | ipfrw 0 | deliv 85494 | icmpi 0 | icmpo 0 | PID TID SYSCPU USRCPU VGROW RGROW RUID EUID THR ST EXC S CPU CMD 1/62 15847 - 0.17s 4.59s 0K 896K grid oracle 1 -- - S 48% oracle 14867 - 0.14s 3.79s 0K 2220K grid oracle 1 -- - R 40% oracle 15835 - 0.15s 3.76s 8192K 384K grid oracle 1 -- - R 39% oracle 14871 - 0.24s 3.59s 0K 0K grid oracle 1 -- - R 39% oracle 15849 - 0.14s 3.55s 0K -1216K grid oracle 1 -- - R 37% oracle Analysis:
| ||||||||||||||||
| Comment by ubTools Support [ 29/Sep/15 03:19 PM ] | ||||||||||||||||
|
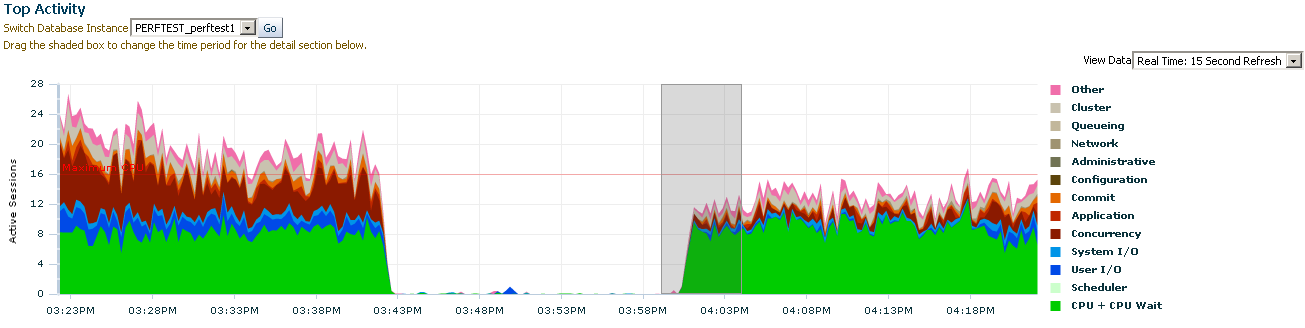
COMPARISION:
30 minutes load test results... 1st: When CPU scaling governor is ondemand. Data: Top Activity:
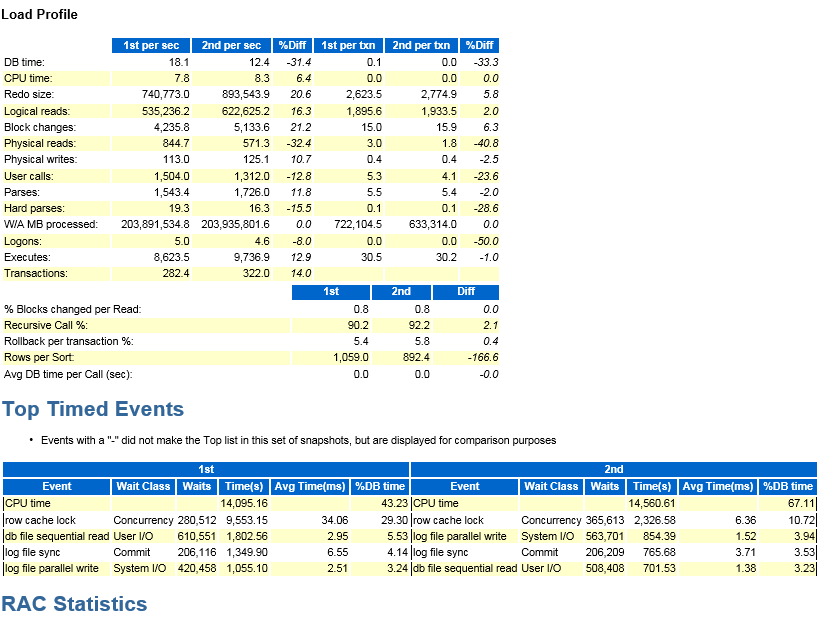
AWR:
Analysis:
| ||||||||||||||||
| Comment by ubTools Support [ 29/Sep/15 03:34 PM ] | ||||||||||||||||
|
SUMMARY:
Analysis:
Recommendations:
| ||||||||||||||||
| Comment by ubTools Support [ 30/Sep/15 09:24 AM ] | ||||||||||||||||
|
CPU TIME and LOGICAL READS:
Data:
Analysis: 8.9% improvements in CPU time caused 31.4% improvement DB time. | ||||||||||||||||
| Comment by ubTools Support [ 02/Oct/15 01:45 PM ] | ||||||||||||||||
| The focus here is to show how CPU scaling governor affects Oracle service and wait times; not to show how to tune Oracle events such as "row cache lock" above. |
[QA-57] ORA-04030 returned by "__libc_sbrk(0x0000000001010020) Err#12 ENOMEM" Created: 02/Dec/13 Updated: 28/Feb/17 |
|
| Status: | Closed |
| Project: | Questions & Answers |
| Fix Version/s: | None |
| Type: | Oracle - Operating System | Priority: | Major |
| Reporter: | ubTools Support | Assignee: | ubTools Support |
| Resolution: | Third-party Problem | Votes: | 0 |
| Product Version: | 10.2.0.4 |
| Operating System: | IBM-AIX |
| Operating System Version: | 6.1 |
| Host Name: | . |
| Database Name: | . |
| Description |
The customer encountered the following problem:
ORA-04030: out of process memory when trying to allocate 2093096 bytes (QERHJ hash-joi,QERHJ list array) |
| Comments |
| Comment by ubTools Support [ 02/Dec/13 02:52 PM ] |
|
ANALYIS 1:
PGASTAT: SQL> select * from v$pgastat order by value; NAME VALUE ---------------------------------------------------------------- ---------- UNIT ------------ maximum PGA used for manual workareas 0 bytes over allocation count 0 total PGA used for manual workareas 0 bytes NAME VALUE ---------------------------------------------------------------- ---------- UNIT ------------ cache hit percentage 98.53 percent process count 126 max processes count 135 NAME VALUE ---------------------------------------------------------------- ---------- UNIT ------------ recompute count (total) 132370 total PGA used for auto workareas 4399104 bytes total freeable PGA memory 106823680 bytes NAME VALUE ---------------------------------------------------------------- ---------- UNIT ------------ maximum PGA used for auto workareas 153909248 bytes global memory bound 214743040 bytes total PGA inuse 747691008 bytes NAME VALUE ---------------------------------------------------------------- ---------- UNIT ------------ total PGA allocated 1180690432 bytes aggregate PGA auto target 1265577984 bytes maximum PGA allocated 1299183616 bytes NAME VALUE ---------------------------------------------------------------- ---------- UNIT ------------ aggregate PGA target parameter 2147483648 bytes extra bytes read/written 1.2622E+10 bytes PGA memory freed back to OS 6.0510E+10 bytes NAME VALUE ---------------------------------------------------------------- ---------- UNIT ------------ bytes processed 8.5171E+11 bytes 19 rows selected. SQL> pga_aggregate_target parmeter is not exceeded. HEAPDUMP: Set Up: To setup tracing to trap the ORA-4030, on the server use the following in SQL*Plus: SQL> ALTER SYSTEM SET EVENTS '4030 trace name heapdump level 536870917;name errorstack level 3'; Once the error reoccurs with the event set, you can turn off tracing using the following command in SQL*Plus: ALTER SYSTEM SET EVENTS '4030 trace name context off; name context off'; Ref: Oracle note: Master Note for Diagnosing OS Memory Problems and ORA-4030 (Doc ID 1088267.1) TRACE: Heap: HEAP DUMP heap name="session heap" desc=11044a830 extent sz=0xff80 alt=32767 het=32767 rec=0 flg=2 opc=2 parent=1101981f0 owner=70000033f6789e8 nex=0 xsz=0x0 ..... Total heap size =108241256 Internal Parameters: _pga_max_size = 419420 KB ..... _smm_max_size = 209710 KB _smm_px_max_size = 1048576 KB No PGA limits are exceeded. |
| Comment by ubTools Support [ 02/Dec/13 03:02 PM ] |
|
ANALYSIS 2:
System Calls: truss -fae -o <outputFile> -p <V$PROCESS.SPID> excerpt: 14483680: 43122723: __libc_sbrk(0x0000000001010020) Err#12 ENOMEM
14483680: 43122723: __libc_sbrk(0x0000000000FE0020) Err#12 ENOMEM
14483680: 43122723: __libc_sbrk(0x0000000001004020) Err#12 ENOMEM
14483680: 43122723: __libc_sbrk(0x0000000000FE0020) Err#12 ENOMEM
14483680: 43122723: __libc_sbrk(0x0000000001001020) Err#12 ENOMEM
14483680: 43122723: __libc_sbrk(0x0000000000FE0020) Err#12 ENOMEM
14483680: 43122723: __libc_sbrk(0x0000000001000420) Err#12 ENOMEM
14483680: 43122723: __libc_sbrk(0x0000000000FDF420) Err#12 ENOMEM
14483680: 43122723: __libc_sbrk(0x0000000001000120) Err#12 ENOMEM
14483680: 43122723: __libc_sbrk(0x0000000000FDF420) Err#12 ENOMEM
14483680: 43122723: __libc_sbrk(0x0000000001000060) Err#12 ENOMEM
14483680: 43122723: __libc_sbrk(0x0000000000FDF420) Err#12 ENOMEM
14483680: 43122723: statx("/oracle/admin/ATSD/udump", 0x0FFFFFFFFFFF41A8, 176, 0) = 0
14483680: 43122723: close(5) = 0
14483680: 43122723: statx("/oracle/admin/ATSD/udump/atsd2_ora_14483680.trc", 0x0FFFFFFFFFFF44C0, 176, 01) Err#2 ENOENT
14483680: 43122723: statx("/oracle/admin/ATSD/udump/atsd2_ora_14483680.trc", 0x0FFFFFFFFFFF44C0, 176, 0) Err#2 ENOENT
14483680: 43122723: kopen("/oracle/admin/ATSD/udump/atsd2_ora_14483680.trc", O_WRONLY|O_CREAT|O_TRUNC|O_LARGEFILE, S_IRUSR|S_IWUSR|S_IRGRP|S_IWGRP) = 5
14483680: 43122723: kwrite(5, 0x0000000104A1C468, 0) = 0
14483680: 43122723: kwrite(5, " / o r a c l e / a d m i".., 47) = 47
When ORA-4030 error occured, trace file ("/oracle/admin/ATSD/udump/atsd2_ora_14483680.trc was created. So, the problem occured before its generation at _libc_sbrk with return code of _ENOMEM. The system could not return memory to Oracle process. User resource limits: oracle@atlasdb2:/home/oracle/dunal >ulimit -a time(seconds) unlimited file(blocks) unlimited data(kbytes) unlimited stack(kbytes) unlimited memory(kbytes) unlimited coredump(blocks) unlimited nofiles(descriptors) unlimited threads(per process) unlimited processes(per user) unlimited oracle@atlasdb2:/home/oracle/dunal > No limit was found for oracle user. |
| Comment by ubTools Support [ 02/Dec/13 03:10 PM ] |
| The system admin will work on this problem. The solution will be added here. |
| Comment by ubTools Support [ 28/Feb/17 09:01 AM ] |
| There was no response from the system admin. But, the problem was a resource limit problem that Oracle user could not allocate memory. |
[QA-54] Unable to close database by srvctl and racgimon takes 100% of CPU. Created: 26/Mar/13 Updated: 26/Mar/13 |
|
| Status: | Closed |
| Project: | Questions & Answers |
| Fix Version/s: | None |
| Type: | Oracle - Operating System | Priority: | Major |
| Reporter: | ubTools Support | Assignee: | ubTools Support |
| Resolution: | Answered | Votes: | 0 |
| Product Version: | 11.2.0.3 |
| Operating System: | Solaris |
| Host Name: | . |
| Database Name: | . |
| Description |
Unable to close the database:
$ srvctl stop database -d ESIBASE
PRKP-1002 : Error stopping instance ESIBASE1 on node ersteracsrv1
CRS-0216: Could not stop resource 'ora.ESIBASE.ESIBASE1.inst'.
$
2 racgimon processes take 100% of CPU in prstat output: PID USERNAME USR SYS TRP TFL DFL LCK SLP LAT VCX ICX SCL SIG PROCESS/NLWP
8286 oracle 64 36 0.0 0.0 0.0 0.0 0.0 0.0 0 37 .15 0 racgimon/1
7903 oracle 65 35 0.0 0.0 0.0 0.0 0.0 0.0 0 35 .15 0 racgimon/1
10015 root 0.0 0.8 0.0 0.0 0.0 0.0 99 0.0 21 1 398 0 prstat/1
7818 oracle 0.2 0.0 0.0 0.0 0.0 0.0 100 0.0 62 1 7K 0 oracle/2
10055 root 0.0 0.1 0.0 0.0 0.0 0.0 100 0.0 7 0 318 0 sleep/1
816 root 0.0 0.0 0.0 0.0 0.0 0.0 100 0.0 30 1 275 0 init.cssd/1
1916 oracle 0.1 0.0 0.0 0.0 0.0 0.0 100 0.0 60 0 719 59 oracle/1
1878 oracle 0.0 0.0 0.0 0.0 0.0 0.0 100 0.0 170 0 694 1 oracle/1
1874 oracle 0.0 0.0 0.0 0.0 0.0 0.0 100 0.0 170 0 691 1 oracle/1
1872 oracle 0.0 0.0 0.0 0.0 0.0 0.0 100 0.0 81 0 401 31 oracle/1
1621 oracle 0.0 0.0 0.0 0.0 0.0 0.0 100 0.0 53 0 343 1 oracle/1
1894 oracle 0.0 0.0 0.0 0.0 0.0 0.0 100 0.0 21 0 54 0 oracle/2
1625 oracle 0.0 0.0 0.0 0.0 0.0 0.0 100 0.0 64 0 201 1 oracle/1
1623 oracle 0.0 0.0 0.0 0.0 0.0 0.0 100 0.0 64 0 201 1 oracle/1
1870 oracle 0.0 0.0 0.0 0.0 0.0 0.0 100 0.0 59 0 347 1 oracle/2
NPROC USERNAME SWAP RSS MEMORY TIME CPU
72 oracle 21G 21G 57% 0:07:37 26%
54 root 117M 180M 0.5% 0:00:06 0.2%
1 noaccess 136M 207M 0.6% 0:00:12 0.0%
6 daemon 6408K 7496K 0.0% 0:00:00 0.0%
1 smmsp 1136K 7244K 0.0% 0:00:00 0.0%
Total: 134 processes, 439 lwps, load averages: 2.26, 1.82, 1.13
#
|
| Comments |
| Comment by ubTools Support [ 26/Mar/13 03:01 PM ] |
|
ANALYSIS 1:
truss output of one of _racgimon: # truss -fae -p 8286
8286: close(346745079) Err#9 EBADF
8286: close(346745080) Err#9 EBADF
8286: close(346745081) Err#9 EBADF
8286: close(346745082) Err#9 EBADF
8286: close(346745083) Err#9 EBADF
8286: close(346745084) Err#9 EBADF
8286: close(346745085) Err#9 EBADF
8286: close(346745086) Err#9 EBADF
# truss -faec -p 8286
psargs: /u01/app/oracle/product/10.2/bin/racgimon startd ESIBASE
^C
syscall seconds calls errors
close 2.374 1857265 1857265
-------- ------ ----
sys totals: 2.374 1857265 1857265
usr time: 1.079
elapsed: 23.090
#
Comment: racgimon could not close file descriptors. It repeats to close different file descriptors which are incremented 1 in each subsequent close() system call. close() system calls return EBADF, which is The fildes argument is not a valid file descriptor. |
| Comment by ubTools Support [ 26/Mar/13 03:09 PM ] |
|
ANALYSIS 2:
prctl outpur of racgimon: # prctl 8286
process: 8286: /u01/app/oracle/product/10.2/bin/racgimon startd ESIBASE
NAME PRIVILEGE VALUE FLAG ACTION
RECIPIENT
process.max-port-events
privileged 65.5K - deny
-
system 2.15G max deny
-
process.max-msg-messages
privileged 8.19K - deny
-
system 4.29G max deny
-
process.max-msg-qbytes
privileged 64.0KB - deny
-
system 16.0EB max deny
-
process.max-sem-ops
privileged 512 - deny
-
system 2.15G max deny
-
process.max-sem-nsems
privileged 512 - deny
-
system 32.8K max deny
-
process.max-address-space
privileged 16.0EB max deny
-
system 16.0EB max deny
-
process.max-file-descriptor
privileged 2.15G max deny
-
system 2.15G max deny
-
process.max-core-size
basic 0B - deny
8286
system 8.00EB max deny
-
process.max-stack-size
basic 10.0MB - deny
8286
privileged 125TB - deny
-
system 125TB max deny
-
process.max-data-size
privileged 16.0EB max deny
-
system 16.0EB max deny
-
process.max-file-size
privileged 8.00EB max deny,signal=XFSZ
-
system 8.00EB max deny
-
process.max-cpu-time
privileged 18.4Es inf signal=XCPU
-
system 18.4Es inf none
-
task.max-cpu-time
system 18.4Es inf none
-
task.max-lwps
system 2.15G max deny
-
project.max-contracts
privileged 10.0K - deny
-
system 2.15G max deny
-
project.max-device-locked-memory
privileged 2.19GB - deny
-
system 16.0EB max deny
-
project.max-locked-memory
system 16.0EB max deny
-
project.max-port-ids
privileged 8.19K - deny
-
system 65.5K max deny
-
project.max-shm-memory
privileged 24.0GB - deny
-
system 16.0EB max deny
-
project.max-shm-ids
privileged 128 - deny
-
system 16.8M max deny
-
project.max-msg-ids
privileged 128 - deny
-
system 16.8M max deny
-
project.max-sem-ids
privileged 128 - deny
-
system 16.8M max deny
-
project.max-crypto-memory
privileged 8.77GB - deny
-
system 16.0EB max deny
-
project.max-tasks
system 2.15G max deny
-
project.max-lwps
system 2.15G max deny
-
project.cpu-cap
system 4.29G inf deny
-
project.cpu-shares
privileged 1 - none
-
system 65.5K max none
-
zone.max-swap
system 16.0EB max deny
-
zone.max-locked-memory
system 16.0EB max deny
-
zone.max-shm-memory
system 16.0EB max deny
-
zone.max-shm-ids
system 16.8M max deny
-
zone.max-sem-ids
system 16.8M max deny
-
zone.max-msg-ids
system 16.8M max deny
-
zone.max-lwps
system 2.15G max deny
-
zone.cpu-cap
system 4.29G inf deny
-
zone.cpu-shares
privileged 1 - none
-
system 65.5K max none
-
$ prctl -n process.max-file-descriptor -i process $$
process: 7615: -sh
NAME PRIVILEGE VALUE FLAG ACTION
RECIPIENT
process.max-file-descriptor
basic 4.10K - deny
7615
system 2.15G max deny
-
$
Comment: privileged option of process.max-file-descriptor had reached to 2.15G descriptors. But, no privileged option had been set to it. |
| Comment by ubTools Support [ 26/Mar/13 03:21 PM ] |
|
WORKAROUND:
Set privileged option to a value as an example below: # projmod -s -K "process.max-file-descriptor=(basic,4096,deny),(privileged,65536,deny)" 'user.oracle' After setting, check as below: $ prctl -n process.max-file-descriptor -i process $$
process: 708: -sh
NAME PRIVILEGE VALUE FLAG ACTION RECIPIENT
process.max-file-descriptor
basic 4.10K - deny 708
privileged 65.5K - deny -
system 2.15G max deny -
$
See similar problem for lower Oracle versions in Oracle note srvctl Slow or Fails to Start/Stop Database Instance and crsd.bin/racgmain/racgimon High CPU Usage [ID 1457387.1]. |
[QA-50] PRVF-5410 : Check of common NTP Time Server failed, PRVF-5416 : Query of NTP daemon failed on all nodes Created: 13/May/11 Updated: 13/May/11 |
|
| Status: | Closed |
| Project: | Questions & Answers |
| Fix Version/s: | None |
| Type: | Oracle - Operating System | Priority: | Major |
| Reporter: | ubTools Support | Assignee: | ubTools Support |
| Resolution: | Answered | Votes: | 0 |
| Product Version: | CVU 11g |
| Operating System: | Solaris |
| Operating System Version: | 10 |
| Host Name: | . |
| Database Name: | . |
| Description |
|
Errors:
The customer encountered the following errors in CVU: ./cluvfy stage -pre crsinst -n detrac1,detrac2 -verbose ..... NTP common Time Server Check started... PRVF-5410 : Check of common NTP Time Server failed PRVF-5416 : Query of NTP daemon failed on all nodes Result: Clock synchronization check using Network Time Protocol(NTP) failed ..... NTP: # ntpq -p
remote refid st t when poll reach delay offset disp
==============================================================================
*<REMOVED> LOCAL(0) <REMOVED>
#
Same on both nodes. CVU log: .....
[978@detrac1] [main] [ 2011-05-13 17:09:51.490 EEST ] [TaskNTP.getTimeServerInfo:838] Output from NTP query command on node detrac1 is =
remote refid st t when poll reach delay offset disp
==============================================================================
*<REMOVED> LOCAL(0) <REMOVED>
[978@detrac1] [main] [ 2011-05-13 17:09:51.492 EEST ] [TaskNTP.getTimeServerInfo:864] Parsing of NTP query output line FAILED. Line=
*<REMOVED> LOCAL(0) <REMOVED>
[978@detrac1] [main] [ 2011-05-13 17:09:51.492 EEST ] [TaskNTP.getTimeServerInfo:880] NTP query on node detrac1 did NOT produce valid output.
[978@detrac1] [main] [ 2011-05-13 17:09:51.492 EEST ] [TaskNTP.getTimeServerInfo:838] Output from NTP query command on node detrac2 is =
remote refid st t when poll reach delay offset disp
==============================================================================
*<REMOVED> LOCAL(0) <REMOVED>
[978@detrac1] [main] [ 2011-05-13 17:09:51.493 EEST ] [TaskNTP.getTimeServerInfo:864] Parsing of NTP query output line FAILED. Line=
*<REMOVED> LOCAL(0) <REMOVED>
[978@detrac1] [main] [ 2011-05-13 17:09:51.494 EEST ] [TaskNTP.getTimeServerInfo:880] NTP query on node detrac2 did NOT produce valid output.
.....
Ref: $CVU_HOME/cv/log/cvutrace.log.0 |
| Comments |
| Comment by ubTools Support [ 13/May/11 05:47 PM ] |
|
Action: The Network Administrator set an IP to refid for NTP. NTP: # ntpq -p
remote refid st t when poll reach delay offset disp
==============================================================================
*<REMOVED> 72.14.188.52 <REMOVED>
#
CVU Log: .....
[967@detrac1] [main] [ 2011-05-13 19:21:19.426 EEST ] [TaskNTP.getTimeServerInfo:838] Output from NTP query command on node detrac1 is =
remote refid st t when poll reach delay offset disp
==============================================================================
*<REMOVED> 72.14.188.52 <REMOVED>
[967@detrac1] [main] [ 2011-05-13 19:21:19.433 EEST ] [TimeServerNode.addDataToNode:66] TimeServerNode:addDataToNode():Parsing line:
*<REMOVED> 72.14.188.52 <REMOVED>
[967@detrac1] [main] [ 2011-05-13 19:21:19.434 EEST ] [TimeServerNode.addDataToNode:79] Parsed Value[0]=<REMOVED>
[967@detrac1] [main] [ 2011-05-13 19:21:19.434 EEST ] [TimeServerNode.addDataToNode:79] Parsed Value[1]=72.14.188.52
[967@detrac1] [main] [ 2011-05-13 19:21:19.434 EEST ] [TimeServerNode.addDataToNode:79] Parsed Value[2]=<REMOVED>
[967@detrac1] [main] [ 2011-05-13 19:21:19.435 EEST ] [TimeServerNode.addDataToNode:79] Parsed Value[3]=<REMOVED>
[967@detrac1] [main] [ 2011-05-13 19:21:19.435 EEST ] [TimeServerNode.addDataToNode:79] Parsed Value[4]=<REMOVED>
[967@detrac1] [main] [ 2011-05-13 19:21:19.436 EEST ] [TimeServerNode.addDataToNode:79] Parsed Value[5]=<REMOVED>
[967@detrac1] [main] [ 2011-05-13 19:21:19.436 EEST ] [TimeServerNode.addDataToNode:79] Parsed Value[6]=<REMOVED>
[967@detrac1] [main] [ 2011-05-13 19:21:19.437 EEST ] [TimeServerNode.addDataToNode:79] Parsed Value[7]=<REMOVED>
[967@detrac1] [main] [ 2011-05-13 19:21:19.437 EEST ] [TimeServerNode.addDataToNode:79] Parsed Value[8]=<REMOVED>
[967@detrac1] [main] [ 2011-05-13 19:21:19.438 EEST ] [TimeServerNode.addDataToNode:79] Parsed Value[9]=<REMOVED>
[967@detrac1] [main] [ 2011-05-13 19:21:19.438 EEST ] [TaskNTP.getTimeServerInfo:838] Output from NTP query command on node detrac2 is =
remote refid st t when poll reach delay offset disp
==============================================================================
*<REMOVED> 72.14.188.52 <REMOVED>
[967@detrac1] [main] [ 2011-05-13 19:21:19.439 EEST ] [TimeServerNode.addDataToNode:66] TimeServerNode:addDataToNode():Parsing line:
*<REMOVED> 72.14.188.52 <REMOVED>
[967@detrac1] [main] [ 2011-05-13 19:21:19.440 EEST ] [TimeServerNode.addDataToNode:79] Parsed Value[0]=<REMOVED>
[967@detrac1] [main] [ 2011-05-13 19:21:19.440 EEST ] [TimeServerNode.addDataToNode:79] Parsed Value[1]=72.14.188.52
[967@detrac1] [main] [ 2011-05-13 19:21:19.441 EEST ] [TimeServerNode.addDataToNode:79] Parsed Value[2]=<REMOVED>
[967@detrac1] [main] [ 2011-05-13 19:21:19.441 EEST ] [TimeServerNode.addDataToNode:79] Parsed Value[3]=<REMOVED>
[967@detrac1] [main] [ 2011-05-13 19:21:19.441 EEST ] [TimeServerNode.addDataToNode:79] Parsed Value[4]=<REMOVED>
[967@detrac1] [main] [ 2011-05-13 19:21:19.442 EEST ] [TimeServerNode.addDataToNode:79] Parsed Value[5]=<REMOVED>
[967@detrac1] [main] [ 2011-05-13 19:21:19.442 EEST ] [TimeServerNode.addDataToNode:79] Parsed Value[6]=<REMOVED>
[967@detrac1] [main] [ 2011-05-13 19:21:19.443 EEST ] [TimeServerNode.addDataToNode:79] Parsed Value[7]=<REMOVED>
[967@detrac1] [main] [ 2011-05-13 19:21:19.443 EEST ] [TimeServerNode.addDataToNode:79] Parsed Value[8]=<REMOVED>
[967@detrac1] [main] [ 2011-05-13 19:21:19.444 EEST ] [TimeServerNode.addDataToNode:79] Parsed Value[9]=<REMOVED>
[967@detrac1] [main] [ 2011-05-13 19:21:19.444 EEST ] [TaskNTP.doTimeServerCheck:736] tsId=72.14.188.52; tServer
.....
CVU could parse ntpq output. CVU Output: ..... NTP common Time Server Check started... NTP Time Server "72.14.188.52" is common to all nodes on which the NTP daemon is running Check of common NTP Time Server passed Clock time offset check from NTP Time Server started... Checking on nodes "[detrac1, detrac2]"... Check: Clock time offset from NTP Time Server Time Server: 72.14.188.52 Time Offset Limit: 1000.0 msecs Node Name Time Offset Status ------------ ------------------------ ------------------------ detrac1 -2.332 passed detrac2 -2.842 passed Time Server "72.14.188.52" has time offsets that are within permissible limits for nodes "[detrac1, detrac2]". Clock time offset check passed Result: Clock synchronization check using Network Time Protocol(NTP) passed ..... |
| Comment by ubTools Support [ 13/May/11 06:04 PM ] |
|
Solution:
The Network Administrator set an IP to refid for NTP. |
[QA-48] Unable to start VIP because of invalid RX packets numbers. Created: 18/Mar/09 Updated: 19/Mar/09 |
|
| Status: | Closed |
| Project: | Questions & Answers |
| Fix Version/s: | None |
| Type: | Oracle - Operating System | Priority: | Major |
| Reporter: | ubTools Support | Assignee: | ubTools Support |
| Resolution: | Answered | Votes: | 0 |
| Product Version: | Oracle 10.2.0.4, RAC |
| Operating System: | IBM-AIX |
| Operating System Version: | 6.1 |
| Description |
|
*When starting a VIP on a node, it fails and started on the other node.
Starting the VIP: # ./crs_start ora.akyorap2.vip Attempting to start `ora.akyorap2.vip` on member `akyorap2` Start of `ora.akyorap2.vip` on member `akyorap2` failed. Attempting to start `ora.akyorap2.vip` on member `akyorap1` Start of `ora.akyorap2.vip` on member `akyorap1` succeeded. # The log level increased to get more detailed diagnostic data. Setting Log Level: #./crsctl debug log res "ora.akyorap2.vip:1" Set Resource Debug Module: ora.akyorap2.vip Level: 1 # Errors from the Log: Wed Mar 18 20:58:49 GMT+02:00 2009 [ 413770 ] checkIf: start for if=en1 Wed Mar 18 20:58:49 GMT+02:00 2009 [ 413770 ] IsIfAlive: start for if=en1 2009-03-18 20:58:52.212: [ RACG][1] [360462][1][ora.akyorap2.vip]: Wed Mar 18 20:58:49 GMT+02:00 2009 [ 413770 ] defaultgw: started Wed Mar 18 20:58:49 GMT+02:00 2009 [ 413770 ] defaultgw: completed with 10.46.1 80.1 2009-03-18 20:58:52.212: [ RACG][1] [360462][1][ora.akyorap2.vip]: Wed Mar 18 20:58:49 GMT+02:00 2009 [ 413770 ] About to execute command: /usr/sbin/ping -S 10.46.180.52 -c 1 -w 1 10.46.180.1 2009-03-18 20:58:52.212: [ RACG][1] [360462][1][ora.akyorap2.vip]: Wed Mar 18 20:58:51 GMT+02:00 2009 [ 413770 ] About to execute command: /usr/sbin/ping -S 10.46.180.52 -c 1 -w 1 10.46.180.1 2009-03-18 20:58:52.212: [ RACG][1] [360462][1][ora.akyorap2.vip]: Wed Mar 18 20:58:52 GMT+02:00 2009 [ 413770 ] IsIfAlive: RX packets checked if=en1 failed Wed Mar 18 20:58:52 GMT+02:00 2009 [ 413770 ] Interface en1 checked failed (host =akyorap2) Wed Mar 18 20:58:52 GMT+02:00 2009 [ 413770 ] IsIfAlive: end for if=en1 2009-03-18 20:58:52.212: [ RACG][1] [360462][1][ora.akyorap2.vip]: Wed Mar 18 20:58:52 GMT+02:00 2009 [ 413770 ] checkIf: end for if=en1 Invalid parameters, or failed to bring up VIP (host=akyorap2) |
| Comments |
| Comment by ubTools Support [ 18/Mar/09 08:10 PM ] |
|
The problem raised from IsIfAlive() of $ORA_CRS_HOME/racgvip.
Here are the related excerpt from racgvip: # Check the status of the interface thro' pinging gateway
if [ -n "$DEFAULTGW" ]
then
_RET=1
# get base IP address of the interface
tmpIP=`$LSATTR -El ${_IF} -a netaddr | $AWK '{print $2}'`
# get RX packets numbers
_O1=`$NETSTAT -n -I $_IF | $AWK "{ if (/^$_IF/) {print \\$5; exit}}"`
x=$CHECK_TIMES
while [ $x -gt 0 ]
do
if [ -n "$tmpIP" ]
then
logx "About to execute command: $PING -S $tmpIP $PING_TIMEOUT $DEFAULTGW
"
$PING -S $tmpIP $PING_TIMEOUT $DEFAULTGW > /dev/null 2>&1
else
logx "About to execute command: $PING $PING_TIMEOUT $DEFAULTGW"
$PING $PING_TIMEOUT $DEFAULTGW > /dev/null 2>&1
fi
_O2=`$NETSTAT -n -I $_IF | $AWK "{ if (/^$_IF/) {print \\$5; exit}}"`
if [ "$_O1" != "$_O2" ]
then
# RX packets numbers changed
_RET=0
break
fi
$SLEEP 1
x=`$EXPR $x - 1`
done
if [ $_RET -ne 0 ]
then
logx "IsIfAlive: RX packets checked if=$_IF failed"
else
logx "IsIfAlive: RX packets checked if=$_IF OK"
fi
....
According to the the code above, it does the followings:
|
| Comment by ubTools Support [ 18/Mar/09 08:28 PM ] |
racgvip was modified as below to dump the values of _O1 and _O2:
...
    # get RX packets numbers
    _O1=`$NETSTAT -n -I $_IF | $AWK "{ if (/^$_IF/) {print \\$5; exit}}"`
    logx "--------------> by dunal: _O1: $_O1"

    x=$CHECK_TIMES
    while [ $x -gt 0 ]
    do
      if [ -n "$tmpIP" ]
      then
        logx "About to execute command: $PING -S $tmpIP $PING_TIMEOUT $DEFAULTGW
"
        $PING -S $tmpIP $PING_TIMEOUT $DEFAULTGW > /dev/null 2>&1
      else
        logx "About to execute command: $PING $PING_TIMEOUT $DEFAULTGW"
        $PING $PING_TIMEOUT $DEFAULTGW > /dev/null 2>&1
      fi
      _O2=`$NETSTAT -n -I $_IF | $AWK "{ if (/^$_IF/) {print \\$5; exit}}"`
      logx "--------------> by dunal: _O2: $_O2"
...
As seen above, logx "--------------> by dunal: ..." lines are added to the script. Don't do that if you're not sure about what you do. After restarting the VIP, the values of _O1 and _O2 are dumped in the logs. Failed Node: ... Wed Mar 18 20:58:49 GMT+02:00 2009 [ 413770 ] --------------> by dunal: _O1: - 2009-03-18 20:58:52.212: [ RACG][1] [360462][1][ora.akyorap2.vip]: Wed Mar 18 20:58:49 GMT+02:00 2009 [ 413770 ] About to execute command: /usr/sbin/ping -S 10.46.180.52 -c 1 -w 1 10.46.180.1 Wed Mar 18 20:58:50 GMT+02:00 2009 [ 413770 ] --------------> by dunal: _O2: - 2009-03-18 20:58:52.212: [ RACG][1] [360462][1][ora.akyorap2.vip]: Wed Mar 18 20:58:51 GMT+02:00 2009 [ 413770 ] About to execute command: /usr/sbin/ping -S 10.46.180.52 -c 1 -w 1 10.46.180.1 Wed Mar 18 20:58:51 GMT+02:00 2009 [ 413770 ] --------------> by dunal: _O2: - 2009-03-18 20:58:52.212: [ RACG][1] [360462][1][ora.akyorap2.vip]: Wed Mar 18 20:58:52 GMT+02:00 2009 [ 413770 ] IsIfAlive: RX packets checked if=en1 failed Wed Mar 18 20:58:52 GMT+02:00 2009 [ 413770 ] Interface en1 checked failed (host =akyorap2) ... As seen above, the values are '-'. It's wrong. But, they are same. So, RX packet number not changed. Successful Node: Wed Mar 18 20:58:55 GMT+02:00 2009 [ 405728 ] --------------> by dunal: _O1: 17297 2009-03-18 20:58:55.793: [ RACG][1] [397546][1][ora.akyorap2.vip]: Wed Mar 18 20:58:55 GMT+02:00 2009 [ 405728 ] About to execute command: /usr/sbin/ping -S 10.46.180.51 -c 1 -w 1 10.46.180.1 Wed Mar 18 20:58:55 GMT+02:00 2009 [ 405728 ] --------------> by dunal: _O2: 17298 2009-03-18 20:58:55.793: [ RACG][1] [397546][1][ora.akyorap2.vip]: Wed Mar 18 20:58:55 GMT+02:00 2009 [ 405728 ] IsIfAlive: RX packets checked if=en1 OK _O1 and _O2 are different. That means RX packet number changed and the interface is up. |
| Comment by ubTools Support [ 18/Mar/09 08:44 PM ] |
|
netstat Output on Failed Node: /usr/bin/netstat -f inet -n -I en1 | /usr/bin/awk "{ if (/^en1/) {print $5; exit}}"
en1 1500 link#3 0.21.5e.34.55.bc - 34601 0 16269 3 0
The column#5 is '-'. This is wrong and caused the problem. netstat Output on Successful Node: en1 1500 link#3 0.21.5e.34.57.fe 29223 0 10609 3 0 The column#5 is 29223. This is expected number. Headers of netstat on Failed Node: #/usr/bin/netstat -f inet -n -I en1 Name Mtu Network Address ZoneID Ipkts Ierrs Opkts Oerrs Coll en1 1500 link#3 0.21.5e.34.55.bc - 35645 0 16801 3 0 en1 1500 10.46.180 10.46.180.52 - 35645 0 16801 3 0 Headers of netstat on Successful Node: #/usr/bin/netstat -f inet -n -I en1 Name Mtu Network Address ZoneID Ipkts Ierrs Opkts Oerrs Coll en1 1500 link#3 0.21.5e.34.57.fe 29743 0 10762 3 0 en1 1500 10.46.180 10.46.180.51 29743 0 10762 3 0 en1 1500 10.46.180 10.46.180.53 29743 0 10762 3 0 en1 1500 10.46.180 10.46.180.54 29743 0 10762 3 0 The difference is the ZoneID column. Looks like a network configuration problem. This issue will be open for an update from Network Administrators. |
| Comment by ubTools Support [ 19/Mar/09 12:54 PM ] |
|
The Network Adminisitrator said it was an AIX Bug:
But, this fix changes ZoneID from blank value to '-'. After this fix, no VIP could be started. |
| Comment by ubTools Support [ 19/Mar/09 01:11 PM ] |
| No solution found from Metalink. |
| Comment by ubTools Support [ 19/Mar/09 01:45 PM ] |
|
Looks like an inconsistency of Oracle on AIX 6.1.
Workaround: Capturing column number of netstat must be changed from 5 to 6. Original lines for _O1: ...
tmpIP=`$LSATTR -El ${_IF} -a netaddr | $AWK '{print $2}'`
# get RX packets numbers
_O1=`$NETSTAT -n -I $_IF | $AWK "{ if (/^$_IF/) {print \\$5; exit}}"`
x=$CHECK_TIMES
while [ $x -gt 0 ]
...
Modified line for _O1: ...
tmpIP=`$LSATTR -El ${_IF} -a netaddr | $AWK '{print $2}'`
# get RX packets numbers
_O1=`$NETSTAT -n -I $_IF | $AWK "{ if (/^$_IF/) {print \\$6; exit}}"`
x=$CHECK_TIMES
while [ $x -gt 0 ]
...
Original lines for _O2: ...
fi
_O2=`$NETSTAT -n -I $_IF | $AWK "{ if (/^$_IF/) {print \\$5; exit}}"`
if [ "$_O1" != "$_O2" ]
then
# RX packets numbers changed
...
Modified line for _O2: ...
fi
_O2=`$NETSTAT -n -I $_IF | $AWK "{ if (/^$_IF/) {print \\$6; exit}}"`
if [ "$_O1" != "$_O2" ]
then
# RX packets numbers changed
...
Then, VIP could be started on the correct nodes: ./crs_stat -t Name Type Target State Host ------------------------------------------------------------ ora....ap1.gsd application ONLINE ONLINE akyorap1 ora....ap1.ons application ONLINE ONLINE akyorap1 ora....ap1.vip application ONLINE ONLINE akyorap1 ora....ap2.gsd application ONLINE ONLINE akyorap2 ora....ap2.ons application ONLINE ONLINE akyorap2 ora....ap2.vip application ONLINE ONLINE akyorap2 Note: Don't edit Oracle scripts unless you know what you're doing. |
[QA-47] ORA-00354 ORA-00353 ORA-00312: Redolog Block Corruption Created: 10/Mar/09 Updated: 10/Apr/09 |
|
| Status: | Closed |
| Project: | Questions & Answers |
| Fix Version/s: | None |
| Type: | Oracle - Operating System | Priority: | Major |
| Reporter: | ubTools Support | Assignee: | ubTools Support |
| Resolution: | Answered | Votes: | 0 |
| Product Version: | Oracle 10.2.0.4 SE,RAC |
| Operating System: | Solaris |
| Operating System Version: | 10 |
| Description |
|
Problem:
Import causes instance to be hang. During import only one instance is open. imp system/manager file=../yedek/gedik_full.dmp log=../yedek/gedik_full_imp3.log full=y FEEDBACK=1000000 buffer=10000000 RESUMABLE=y RESUMABLE_TIMEOUT=72000 Diagnostic Data for Oracle: Alert Log: Mon Mar 9 19:38:45 2009 ARC0: Log corruption near block 50941 change 9160702125 time ? Mon Mar 9 19:38:45 2009 Errors in file /u01/app/oracle/admin/ORCL/bdump/orcl1_arc0_26085.trc: ORA-00354: corrupt redo log block header ORA-00353: log corruption near block 50941 change 9160702125 time 03/09/2009 1 9:38:35 ORA-00312: online log 1 thread 1: '+DATA/orcl/onlinelog/group_1.516.680795507' ARC0: All Archive destinations made inactive due to error 354 Mon Mar 9 19:38:45 2009 ARC0: Closing local archive destination LOG_ARCHIVE_DEST_1: '/u01/app/oracle/p roduct/10.2.0/dbs/arch/1_27_681074311.dbf' (error 354) (ORCL1) Committing creation of archivelog '/u01/app/oracle/product/10.2.0/dbs/arch/1_2 7_681074311.dbf' (error 354) ARCH: Archival stopped, error occurred. Will continue retrying Archive Log Trace: Corrupt redo block 50941 detected: bad block number Flag: 0x30 Format: 0x38 Block: 0x20302030 Seq: 0x5c305c79 Beg: 0x3030 Cks:0x5 c31 ----- Dump of Corrupt Redo Buffer ----- 5c463830203020305c305c795c3130305c3230305c305c305c305c3020665c30 3030433c5c305c345c305c305c305c305c305c3035320a303a35323920202009 5c305c5030305c303033203120305c32303920383022203520305c315c353034 5c305c3020305c3020725c305c3820373035317231305c315c305c330a305c30 3239353220093a35203843203030433f20372034203530395c3230225c393830 30313030203020315c3630795c3431305c3430305c463830203020305c305c79 5c3130305c32303035320a303a3532395c2020095c305c305c305c30433c2066 5c3430305c305c305c305c305c305c3020305c305c305c5030305c3030292031 20305c32303920383022203520305c310a3320363239353220093a355c305c20 5c305c30203620303038203331725c455c625c365c3331305c305c3020665c30 3030433c20372034203530395c3230225c3938305c3530302030203035320a79 3a3532393020200931305c365c305c3038305c6230305c4641305c3431305c35 5c305c3030305c3020305c3542305c3f5c305c3031305c3030305c3131305c31 425420440a4920353239353220093a35314345205c305c395c3130305c323062 20382030203530395c313022203530305c305c345c305c302035303020372034 303530365c3831315c3230304646463035320a463a3532394320200938412032 Rereading log member '+DATA/orcl/onlinelog/group_1.516.680795507' (corruption ) ... Corrupt redo block 50941 detected: bad block number Flag: 0x0 Format: 0x0 Block: 0x00000000 Seq: 0x00000000 Beg: 0x0 Cks:0x0 ----- Dump of Corrupt Redo Buffer ----- 0000000000000000000000000000000000000000000000000000000000000000 0000000000000000000000000000000000000000000000000000000000000000 0000000000000000000000000000000000000000000000000000000000000000 0000000000000000000000000000000000000000000000000000000000000000 0000000000000000000000000000000000000000000000000000000000000000 0000000000000000000000000000000000000000000000000000000000000000 0000000000000000000000000000000000000000000000000000000000000000 0000000000000000000000000000000000000000000000000000000000000000 0000000000000000000000000000000000000000000000000000000000000000 0000000000000000000000000000000000000000000000000000000000000000 0000000000000000000000000000000000000000000000000000000000000000 0000000000000000000000000000000000000000000000000000000000000000 0000000000000000000000000000000000000000000000000000000000000000 0000000000000000000000000000000000000000000000000000000000000000 0000000000000000000000000000000000000000000000000000000000000000 0000000000000000000000000000000000000000000000000000000000000000 Rereading log member '+DATA/orcl/onlinelog/group_1.516.680795507' (corruption ) ... Corrupt redo block 50941 detected: bad block number Flag: 0x30 Format: 0x38 Block: 0x20302030 Seq: 0x5c305c79 Beg: 0x3030 Cks:0x5 c31 ----- Dump of Corrupt Redo Buffer ----- 5c463830203020305c305c795c3130305c3230305c305c305c305c3020665c30 3030433c5c305c345c305c305c305c305c305c3035320a303a35323920202009 5c305c5030305c303033203120305c32303920383022203520305c315c353034 5c305c3020305c3020725c305c3820373035317231305c315c305c330a305c30 3239353220093a35203843203030433f20372034203530395c3230225c393830 30313030203020315c3630795c3431305c3430305c463830203020305c305c79 5c3130305c32303035320a303a3532395c2020095c305c305c305c30433c2066 5c3430305c305c305c305c305c305c3020305c305c305c5030305c3030292031 20305c32303920383022203520305c310a3320363239353220093a355c305c20 5c305c30203620303038203331725c455c625c365c3331305c305c3020665c30 3030433c20372034203530395c3230225c3938305c3530302030203035320a79 3a3532393020200931305c365c305c3038305c6230305c4641305c3431305c35 5c305c3030305c3020305c3542305c3f5c305c3031305c3030305c3131305c31 425420440a4920353239353220093a35314345205c305c395c3130305c323062 20382030203530395c313022203530305c305c345c305c302035303020372034 303530365c3831315c3230304646463035320a463a3532394320200938412032 *** 2009-03-10 03:55:10.757 62692 kcrr.c As seen above, even if the database hangs, the contents of redo buffer dump change. Diagnostic Data for Solaris: Soft Link Mapping to Raw Devices: oravol1: disk@g600a0b80005a81660000074949959b42:b,raw oravol2: disk@g600a0b80005a816600000742499595ea:b,raw oravol3: disk@g600a0b80005a8166000007444995971e:b,raw oravol4: disk@g600a0b80005a8c9f000004f049959717:b,raw oravol5: disk@g600a0b80005a8c9f000004f249959991:b,raw Open File Descriptors of ARCH process: bash-3.00$ ps -ef|grep arc0 oracle 19941 14227 0 04:10:31 pts/12 0:00 grep arc0 oracle 26085 1 0 19:25:05 ? 0:29 ora_arc0_ORCL1 bash-3.00$ ls -ltr /proc/26085/path ... lrwxrwxrwx 1 oracle oinstall 0 Mar 9 19:25 261 -> /devices/scsi_vhci/disk@g600a0b80005a816600000742499595ea:b,raw lrwxrwxrwx 1 oracle oinstall 0 Mar 9 19:25 260 -> /devices/scsi_vhci/disk@g600a0b80005a8c9f000004f049959717:b,raw lrwxrwxrwx 1 oracle oinstall 0 Mar 9 19:25 259 -> /devices/scsi_vhci/disk@g600a0b80005a81660000074949959b42:b,raw lrwxrwxrwx 1 oracle oinstall 0 Mar 9 19:25 257 -> /devices/scsi_vhci/disk@g600a0b80005a8166000007444995971e:b,raw lrwxrwxrwx 1 oracle oinstall 0 Mar 9 19:25 256 -> /devices/scsi_vhci/disk@g600a0b80005a8c9f000004f249959991:b,raw ... bash-3.00$ Gathering truss output for ARCH: truss -fae -w 261,260,259,257,256 -r 261,260,259,257,256 -o arc0.truss.log -p 26085 The command above will trace system calls with pread()/pwrite() IO buffer dumping for fd of 261,260,259,257,256. Open File Descriptors of LGWR process: bash-3.00$ ps -ef|grep lgwr oracle 28447 1 0 Mar 04 ? 0:17 asm_lgwr_+ASM1 oracle 25925 1 0 19:24:49 ? 0:38 ora_lgwr_ORCL1 oracle 26468 14227 0 04:21:02 pts/12 0:00 grep lgwr bash-3.00$ ls -ltr /proc/25925/path ... lrwxrwxrwx 1 oracle oinstall 0 Mar 9 19:24 260 -> /devices/scsi_vhci/disk@g600a0b80005a816600000742499595ea:b,raw lrwxrwxrwx 1 oracle oinstall 0 Mar 9 19:24 259 -> /devices/scsi_vhci/disk@g600a0b80005a81660000074949959b42:b,raw lrwxrwxrwx 1 oracle oinstall 0 Mar 9 19:24 258 -> /devices/scsi_vhci/disk@g600a0b80005a8c9f000004f049959717:b,raw lrwxrwxrwx 1 oracle oinstall 0 Mar 9 19:24 257 -> /devices/scsi_vhci/disk@g600a0b80005a8166000007444995971e:b,raw lrwxrwxrwx 1 oracle oinstall 0 Mar 9 19:24 256 -> /devices/scsi_vhci/disk@g600a0b80005a8c9f000004f249959991:b,raw ... Gathering truss output for ARCH: bash-3.00$ truss -fae -w 260,259,258,257,256 -r 260,259,258,257,256 -o lgwr.truss.log -p 25925 & The command above will trace system calls with pread()/pwrite() IO buffer dumping for fd of 260,259,258,257,256. |
| Comments |
| Comment by ubTools Support [ 10/Mar/09 03:49 AM ] |
Last Successful Log Switch:
Beginning log switch checkpoint up to RBA [0x19.2.10], SCN: 9160700232
Mon Mar  9 19:38:21 2009
Thread 1 advanced to log sequence 25 (LGWR switch)
  Current log# 1 seq# 25 mem# 0: +DATA/orcl/onlinelog/group_1.516.680795507
Thread 1 cannot allocate new log, sequence 26
Checkpoint not complete
  Current log# 1 seq# 25 mem# 0: +DATA/orcl/onlinelog/group_1.516.680795507
Mon Mar  9 19:38:28 2009
Completed checkpoint up to RBA [0x19.2.10], SCN: 9160700232
As seen above, the last successful sequence before the corruption is 25. Header of Archive Log: (root@gdksun1:bin)$ dd if=/u01/app/oracle/product/10.2.0/dbs/arch/1_25_681074311.dbf
bs=512 skip=50941 count=1|od -x
0000000 2201 0000 c6fd 0000 0019 0000 81d8 54c6
<blockNo>
0000020 2e32 3134 362e 0736 6b78 1207 2f0f 0212
0000040 332d 002c 0505 3831 3834 0532 7567 6469
0000060 0c65 3838 322e 3433 382e 2e38 3138 7807
0000100 076b 0f12 172f 3001 002c 0505 3032 3834
0000120 0739 7362 7361 6369 0e69 3538 312e 3530
0000140 312e 3535 322e 3233 7807 076b 0f12 172f
The block number is 0x0000c6fd (bytes swapped since the platform is little endian). Since 50941=0x0000c6fd, block number in archive log is correct. That means, LGWR had successfuly written the correct redo before the log switch. |
| Comment by ubTools Support [ 10/Mar/09 03:59 AM ] |
|
Computing the Offset of Corrupted ASM Block:
SQL> select GROUP_NUMBER,NAME,ALLOCATION_UNIT_SIZE from v$asm_diskgroup; GROUP_NUMBER NAME ALLOCATION_UNIT_SIZE
------------ ------------------------- --------------------
1 DATA 1048576
SQL> select GROUP_NUMBER, DISK_NUMBER, name, path
from v$asm_disk;
GROUP_NUMBER DISK_NUMBER NAME PATH
------------ ----------- ------------------------- --------------------
1 0 DATA_0000 /u01/oradata/oravol1
1 1 DATA_0001 /u01/oradata/oravol2
1 2 DATA_0002 /u01/oradata/oravol3
1 3 DATA_0003 /u01/oradata/oravol4
1 4 DATA_0004 /u01/oradata/oravol5
SQL> select BLOCK_SIZE from  v$asm_file where FILE_NUMBER=516;

BLOCK_SIZE
----------
       512
SQL> select DISK_KFFXP,  AU_KFFXP from x$kffxp
     where XNUM_KFFXP=24 and group_kffxp=1 and  NUMBER_KFFXP=516;

DISK_KFFXP   AU_KFFXP
---------- ----------
         1      60884
Disk#1 : /u01/oradata/oravol2 |
| Comment by ubTools Support [ 10/Mar/09 04:47 AM ] |
|
Interpreting the truss Output of ARCH:
fd#261 is /u01/oradata/oravol2 for ARCH. Reading Offsets by ARCH: bash-3.00$ grep "pread(261" arc0.truss.log 26085: pread(261, 0xFFFFFD7FFC32DE00, 131072, 0xEDE600000) = 131072 26085: pread(261, 0xFFFFFD7FFC21CE00, 131072, 0xEDE620000) = 131072 26085: pread(261, 0xFFFFFD7FFC10BE00, 131072, 0xEDE640000) = 131072 26085: pread(261, 0xFFFFFD7FFBE2DE00, 131072, 0xEDE660000) = 131072 26085: pread(261, 0xFFFFFD7FFBA2DE00, 131072, 0xEDE680000) = 131072 26085: pread(261, 0xFFFFFD7FFB42DE00, 131072, 0xEDE6A0000) = 131072 26085: pread(261, 0xFFFFFD7FFB53DE00, 131072, 0xEDE6C0000) = 131072 26085: pread(261, 0xFFFFFD7FFB64DE00, 131072, 0xEDE6E0000) = 131072 26085: pread(261, 0xFFFFFD7FFADCDE00, 131072, 0xEDE700000) = 131072 26085: pread(261, 0xFFFFFD7FFAE6DE00, 131072, 0xEDE800000) = 131072 26085: pread(261, 0xFFFFFD7FFAEDDE00, 131072, 0xEDE720000) = 131072 26085: pread(261, 0xFFFFFD7FFAF7DE00, 131072, 0xEDE820000) = 131072 26085: pread(261, 0xFFFFFD7FFC2CDE00, 131072, 0xEDE740000) = 131072 26085: pread(261, 0xFFFFFD7FFC36DE00, 131072, 0xEDE840000) = 131072 26085: pread(261, 0xFFFFFD7FFC1BCE00, 131072, 0xEDE760000) = 131072 26085: pread(261, 0xFFFFFD7FFC25CE00, 131072, 0xEDE860000) = 131072 26085: pread(261, 0xFFFFFD7FFC0ABE00, 131072, 0xEDE780000) = 131072 26085: pread(261, 0xFFFFFD7FFC14BE00, 131072, 0xEDE880000) = 131072 26085: pread(261, 0xFFFFFD7FFBDCDE00, 131072, 0xEDE7A0000) = 131072 26085: pread(261, 0xFFFFFD7FFBE6DE00, 131072, 0xEDE8A0000) = 131072 26085: pread(261, 0xFFFFFD7FFB9CDE00, 131072, 0xEDE7C0000) = 131072 26085: pread(261, 0xFFFFFD7FFBA6DE00, 131072, 0xEDE8C0000) = 131072 26085: pread(261, 0xFFFFFD7FFB3CDE00, 131072, 0xEDE7E0000) = 131072 26085: pread(261, 0xFFFFFD7FFB46DE00, 131072, 0xEDE8E0000) = 131072 26085: pread(261, 0xFFFFFD7FFB51DE00, 131072, 0xEDE900000) = 131072 26085: pread(261, 0xFFFFFD7FFB62DE00, 131072, 0xEDE920000) = 131072 26085: pread(261, 0xFFFFFD7FFAE0DE00, 131072, 0xEDE940000) = 131072 26085: pread(261, 0xFFFFFD7FFAF1DE00, 131072, 0xEDE960000) = 131072 26085: pread(261, 0xFFFFFD7FFC30DE00, 131072, 0xEDE980000) = 131072 26085: pread(261, 0xFFFFFD7FFC1FCE00, 131072, 0xEDE9A0000) = 131072 26085: pread(261, 0xFFFFFD7FFC0EBE00, 131072, 0xEDE9C0000) = 131072 26085: pread(261, 0xFFFFFD7FFBE0DE00, 131072, 0xEDE9E0000) = 131072 26085: pread(261, 0xFFFFFD7FFBEADE00, 512, 0xEDD400000) = 512 26085: pread(261, 0xFFFFFD7FFB9AE000, 130560, 0xEDD400200) = 130560 26085: pread(261, 0xFFFFFD7FFBA4DE00, 131072, 0xEDD500000) = 131072 26085: pread(261, 0xFFFFFD7FFBAADE00, 512, 0xEDD420000) = 512 26085: pread(261, 0xFFFFFD7FFB9AE000, 130560, 0xEDD400200) = 130560 26085: pread(261, 0xFFFFFD7FFBA4DE00, 131072, 0xEDD500000) = 131072 26085: pread(261, 0xFFFFFD7FFBAADE00, 512, 0xEDD420000) = 512 26085: pread(261, 0xFFFFFD7FFC53BE00, 16384, 0xEDDED4000) = 16384 bash-3.00$ As seen above, offsets starting with 0xEDE and 0xEDD5 are greater than our corrupted offset of 0xEDD4DFA00. So, They are out of the scope. The followings should be examined:
ARCH did not read the corrupted block#50941. But, it reported an error. dd Output of the Corrupted Block: ASM Corrupted Block Offset in 512 byte block: 63842417152/512=124692221 bash-3.00$ dd if=/u01/oradata/oravol2 bs=512 iseek=124692221 count=1|od -x
0000000 2201 0000 f0fd 0000 001b 0000 80d8 2304
<blockNo>
0000020 3838 322e 3731 312e 3431 7807 0a6c 111e
0000040 2230 3001 002c 0605 3131 3730 3130 3306
0x0000f0fd is not 50941. So, it's corrupted. The reason why ARCH did not read this block is hidden in the error messages: ORA-00353: log corruption near block 50941 change 9160702125 time 03/09/2009 1 It says near. |
| Comment by ubTools Support [ 10/Mar/09 06:16 AM ] |
|
Finding the Other Corrupted Block:
dd Outputs on pread() of ARCH:
As seen above, the block numbers increase from 0xC000 to 0xC0FF. But, in the last call, it jumped to 0xC800. truss Output of ARCH for block# 0xC800 26085: pread(261, 0xFFFFFD7FFBAADE00, 512, 0xEDD420000) = 512
26085: 01 "\0\0\0C8\0\01B\0\0\0 \80 H -\00505 4 1 4 5 0\v 6 6 6 6 6 6 4
<blockNo>
26085: 1 4 5 00F 2 1 2 . 1 5 6 . 2 3 0 . 2 1 807 x l\n07\f %1F01 0 ,\0
26085: 0505 3 5 6 0 705 3 8 0 3 50E 8 8 . 2 4 1 . 1 3 6 . 2 2 007 x l\n
26085: 07\f %1F01 0 ,\00505 6 2 0 5 1\b a d a m k a c i0E 1 9 5 . 2 4 4
26085: . 6 2 . 1 4 507 x l\n07\f % "01 0 ,\00505 6 2 0 5 1\b a d a m k
26085: a c i\f 7 8 . 1 9 0 . 6 8 . 1 707 x l\n07\f % #01 0 ,\00502 - 1
26085: 05 K A Y A 20E 1 9 5 . 2 4 4 . 6 2 . 1 4 507 x l\n07\f % .02 - 2
26085: ,\00502 - 105 K A Y A 20E 1 9 5 . 2 4 4 . 6 2 . 1 4 507 x l\n07
26085: \f &0102 - 2 ,\00505 6 1 1 4 105 1 9 5 5 60E 1 9 5 . 2 4 4 . 6 2
26085: . 1 4 707 x l\n07\f &\r01 0 ,\00505 6 1 1 4 105 1 9 5 5 6\f 8 8
26085: . 2 3 4 . 5 . 2 3 107 x l\n07\f &0F01 0 ,\00502 - 105 K A Y A 2
26085: 0E 1 9 5 . 2 4 4 . 6 2 . 1 4 507 x l\n07\f &1002 - 2 ,\00506 1 1
26085: 1 0 1 605 O K A Y A\f 8 5 . 1 0 8 . 8 7 . 5 007 x l\n07\f & !01
26085: 0 ,\00502 - 105 K A Y A 20E 1 9 5 . 2 4 4 . 6 2 . 1 4 507 x l\n
26085: 07\f & "02 - 2 ,\00505 4 1 9 3 806 6 4 3 2 5 5\r 8 8 . 2 2 5 . 1
26085: 2 0 . 5 307 x l\n07\f & +01 0 ,\00505 5 3 0 5 506 0 9 1 2 1 90E
Then, the following messages were written to the trace file: 26085: write(2, " * * * 2 0 0 9 - 0 3 -".., 27) = 27
26085: write(2, "\n", 1) = 1
26085: write(2, " ", 1) = 1
26085: write(2, "\n", 1) = 1
26085: write(2, " C o r r u p t r e d o".., 51) = 51
26085: write(2, "\n", 1) = 1
26085: write(2, " F l a g : 0 x 3 0 F".., 80) = 80
26085: write(2, "\n", 1) = 1
26085: write(2, " - - - - - D u m p o".., 39) = 39
26085: write(2, "\n", 1) = 1
26085: write(2, " 5 c 4 6 3 8 3 0 2 0 3 0".., 64) = 64
<blockNoPiece0>
26085: write(2, "\n", 1) = 1
26085: write(2, " 3 0 3 0 4 3 3 c 5 c 3 0".., 64) = 64
<blockNoPiece1>
26085: write(2, "\n", 1) = 1
26085: write(2, " 5 c 3 0 5 c 5 0 3 0 3 0".., 64) = 64
26085: write(2, "\n", 1) = 1
26085: write(2, " 5 c 3 0 5 c 3 0 2 0 3 0".., 64) = 64
26085: write(2, "\n", 1) = 1
26085: write(2, " 3 2 3 9 3 5 3 2 2 0 0 9".., 64) = 64
26085: write(2, "\n", 1) = 1
26085: write(2, " 3 0 3 1 3 0 3 0 2 0 3 0".., 64) = 64
26085: write(2, "\n", 1) = 1
26085: write(2, " 5 c 3 1 3 0 3 0 5 c 3 2".., 64) = 64
26085: write(2, "\n", 1) = 1
26085: write(2, " 5 c 3 4 3 0 3 0 5 c 3 0".., 64) = 64
26085: write(2, "\n", 1) = 1
26085: write(2, " 2 0 3 0 5 c 3 2 3 0 3 9".., 64) = 64
26085: write(2, "\n", 1) = 1
26085: write(2, " 5 c 3 0 5 c 3 0 2 0 3 6".., 64) = 64
26085: write(2, "\n", 1) = 1
26085: write(2, " 3 0 3 0 4 3 3 c 2 0 3 7".., 64) = 64
26085: write(2, "\n", 1) = 1
26085: write(2, " 3 a 3 5 3 2 3 9 3 0 2 0".., 64) = 64
26085: write(2, "\n", 1) = 1
26085: write(2, " 5 c 3 0 5 c 3 0 3 0 3 0".., 64) = 64
26085: write(2, "\n", 1) = 1
26085: write(2, " 4 2 5 4 2 0 4 4 0 a 4 9".., 64) = 64
26085: write(2, "\n", 1) = 1
26085: write(2, " 2 0 3 8 2 0 3 0 2 0 3 5".., 64) = 64
26085: write(2, "\n", 1) = 1
26085: write(2, " 3 0 3 5 3 0 3 6 5 c 3 8".., 64) = 64
26085: write(2, "\n", 1) = 1
26085: write(2, " R e r e a d i n g l o".., 78) = 78
26085: write(2, "\n", 1) = 1
Rereading the block fails like this. There are 2 problems:
|
| Comment by ubTools Support [ 10/Mar/09 10:19 AM ] |
Checking missing IO of LGWR from truss Output :
bash-3.00$ grep Err lgwr.truss.log|grep pwrite
bash-3.00$ grep Err lgwr.truss.log|grep pread
bash-3.00$
No missing IO. Checking IO buffers of LGWR: fd#260 is /u01/oradata/oravol2 for LGWR. The Last write to block: 25925: pwrite(260, 0x380D78400, 76288, 0xEDD420000) = 76288
25925: 01 "\0\0\0C8\0\01B\0\0\0 \80 H -\00505 4 1 4 5 0\v 6 6 6 6 6 6 4
<blockNo>
25925: 1 4 5 00F 2 1 2 . 1 5 6 . 2 3 0 . 2 1 807 x l\n07\f %1F01 0 ,\0
25925: 0505 3 5 6 0 705 3 8 0 3 50E 8 8 . 2 4 1 . 1 3 6 . 2 2 007 x l\n
As seen above, the contents of redo buffer is corrupted. The block number is 0xC800. But, this LGWR had generated correct archivelog: bash-3.00$ dd if=/u01/app/oracle/product/10.2.0/dbs/arch/1_25_681074311.dbf bs=512 skip=256 count=1|od -x
1+0 records in
1+0 records out
0000000 2201 0000 0100 0000 0019 0000 8000 d162
<blockNo>
0000020 3534 332e 2e33 3032 0733 6b78 0904 3c0c
0000040 0114 2c30 0500 3205 3031 3631 6905 6e69
0x0100 = 256, which is the correct block number. |
| Comment by ubTools Support [ 10/Mar/09 10:35 AM ] |
|
Looks like a configuration issue or a bug in OS/STORAGE side.
This issue handles redo corruption only. But, the database encounters the corruptions on UNDO,INDEX,TABLE, CONTROL FILES, too. But, the root cause is same: Similar to This issue will be updated when a comment is sent by the OS vendor. |
| Comment by ubTools Support [ 10/Apr/09 01:13 PM ] |
| Operating System reinstalled by the vendor. Then problem has not occured. |
[QA-45] 'direct path read temp' hangs on read() system call when ASMLIB in use. Created: 02/Feb/09 Updated: 03/Feb/09 |
|
| Status: | Closed |
| Project: | Questions & Answers |
| Fix Version/s: | None |
| Type: | Oracle - Operating System | Priority: | Major |
| Reporter: | ubTools Support | Assignee: | ubTools Support |
| Resolution: | Answered | Votes: | 0 |
| Product Version: | Oracle 10.2.0.4 Standard Edition, RAC |
| Operating System: | Linux |
| Operating System Version: | SLES 10 SP1 (x86-64) |
| Description |
Environment:
Database......: Oracle 10.2.0.4 Standard Edition, RAC
ASMLIB........: oracleasm-2.6.16.46-0.12-smp-2.0.3-1.x86_64.rpm
                oracleasmlib-2.0.2-1.x86_64.rpm
                oracleasm-support-2.1.2-1.SLE10.x86_64.rpm
Description: direct path read temp hangs on read() system call when ASMLIB in use. Diagnostic Data for Oracle: Wait Event: SQL> select SEQ#,EVENT,P1,P2,P3,WAIT_TIME,SECONDS_IN_WAIT from v$session_wait where sid=512 and state='WAITING';
SEQ# EVENT
---------- ----------------------------------------------------------------
P1 P2 P3 WAIT_TIME SECONDS_IN_WAIT
---------- ---------- ---------- ---------- ---------------
46619 direct path read temp
202 285578 7 0 5611
...
SQL> select SEQ#,EVENT,P1,P2,P3,WAIT_TIME,SECONDS_IN_WAIT from v$session_wait where sid=512 and state='WAITING';
SEQ# EVENT
---------- ----------------------------------------------------------------
P1 P2 P3 WAIT_TIME SECONDS_IN_WAIT
---------- ---------- ---------- ---------- ---------------
46619 direct path read temp
202 285578 7 0 5824
SQL>
The session is waiting for the completion of direct path read temp for 5824 seconds. The SEQ# column is not changing. It's TOO long to read just 7 blocks from the disk. Stack Trace: SQL> select spid from v$session s,v$process p where s.paddr=p.addr and s.sid=512;
SPID
------------
2359
SQL> oradebug SETOSPID 2359
Oracle pid: 38, Unix process pid: 2359, image: oracle@gdksun1
SQL> oradebug dump errorstack 3
Statement processed.
SQL> oradebug TRACEFILE_NAME
/u03/app/oracle/admin/ORCL/udump/orcl1_ora_2359.trc
SQL>
<from the trace file>
Current SQL statement for this session:
CREATE INDEX "ACD2" ON "ACCOUNT_DETAIL" ...
----- Call Stack Trace -----
calling call entry argument values in hex
location type point (? means dubious value)
-------------------- -------- -------------------- ----------------------------
ksedst()+31 call ksedst1() 000000000 ? 000000001 ?
7FFF177ECC40 ? 7FFF177ECCA0 ?
7FFF177ECBE0 ? 000000000 ?
ksedmp()+610 call ksedst() 000000000 ? 000000001 ?
7FFF177ECC40 ? 7FFF177ECCA0 ?
7FFF177ECBE0 ? 000000000 ?
ksdxfdmp()+1118 call ksedmp() 000000003 ? 000000001 ?
7FFF177ECC40 ? 7FFF177ECCA0 ?
7FFF177ECBE0 ? 000000000 ?
ksdxcb()+1547 call ksdxfdmp() 7FFF177EDD90 ? 000000011 ?
000000003 ? 7FFF177EDED0 ?
7FFF177EDE30 ? 000000000 ?
sspuser()+111 call ksdxcb() 000000001 ? 000000011 ?
000000001 ? 000000001 ?
7FFF177EDE30 ? 000000000 ?
__funlockfile()+80 call sspuser() 000000001 ? 000000011 ?
000000001 ? 000000001 ?
7FFF177EDE30 ? 000000000 ?
__read_nocancel()+7 signal __funlockfile() 00000000D ? 7FFF177EE970 ?
000000050 ?
FFFFFFFFFFFFFFFF ?
000000000 ? 2B4E95CCE000 ?
call_instance_read( call __read_nocancel() 00000000D ? 7FFF177EE970 ?
)+12 000000050 ?
FFFFFFFFFFFFFFFF ?
000000000 ? 2B4E95CCE000 ?
asm_io_v2()+185 call call_instance_read( 00000000D ? 7FFF177EE970 ?
) 000000050 ?
FFFFFFFFFFFFFFFF ?
000000000 ? 2B4E95CCE000 ?
kfkOsmIO()+1205 call asm_io_v2() 00000000D ? 7FFF177EE970 ?
000000246 ?
FFFFFFFFFFFFFFFF ?
000000000 ? 2B4E95CCE000 ?
kfkReapIO()+497 call kfkOsmIO() 2B4E95830588 ? 2B4E95AAE000 ?
000000000 ? 000000000 ?
000000000 ? 2B4E95B2E000 ?
kfkIOPriv()+770 call kfkReapIO() 000000000 ? 006110320 ?
2B4E95830588 ? 006110320 ?
006110320 ? 2B4E95B2E000 ?
kfdIOPriv()+95 call kfkIOPriv() 000000000 ? 000000000 ?
000000024 ? 000000000 ?
2B4E95B66040 ? 000000001 ?
kfioReapIO()+476 call kfdIOPriv() 000000000 ? 000000000 ?
000000000 ? 000000000 ?
2B4E95B66040 ? 000000001 ?
kfioRequest()+197 call kfioReapIO() 7FFF177EED68 ? 000000001 ?
0FFFFFFFF ? 000000000 ?
2B4E95B66040 ? 000000001 ?
ksfd_osmwat()+874 call kfioRequest() 000000000 ? 000000000 ?
000000000 ? 000000000 ?
7FFF177EED68 ? 2B4E00000001 ?
ksfdwtio()+693 call ksfd_osmwat() 000000001 ? 000000000 ?
07FFFFFFF ? 000000000 ?
7FFF177EED68 ? 2B4E00000001 ?
ksfdwat1()+220 call ksfdwtio() 000000001 ? 000000030 ?
07FFFFFFF ? 000000000 ?
7FFF177EED68 ? 2B4E00000001 ?
ksfdrwat0()+1269 call ksfdwat1() 000000001 ? 000000030 ?
07FFFFFFF ? 000000000 ?
7FFF177EED68 ? 2B4E00000001 ?
ksfdblock()+156 call ksfdrwat0() 000000001 ? 000000030 ?
07FFFFFFF ? 000000000 ?
2B4E7FFFFFFF ? 2B4E00000001 ?
kcflwi()+48 call ksfdblock() 7FFF177F11C0 ? 000000001 ?
000000010 ? 000000000 ?
2B4E7FFFFFFF ? 2B4E00000001 ?
kcflci()+689 call kcflwi() 2B4E95FF3F28 ? 000000001 ?
000000010 ? 000000000 ?
2B4E7FFFFFFF ? 2B4E00000001 ?
kcblci()+197 call kcflci() 2B4E95FF3F28 ? 000000000 ?
0000000CA ? 000045B8A ?
7FFF177F1270 ? 000000000 ?
kcblcio()+280 call kcblci() 2B4E95D168F0 ? 2B4E95FF3E70 ?
000000001 ? 000045B8A ?
7FFF177F1270 ? 000000000 ?
kcblsltck()+50 call kcblcio() 2B4E95D168F0 ? 2B4E95FF3E70 ?
000000001 ? 000045B8A ?
7FFF177F1270 ? 000000000 ?
stsCheckIO()+194 call kcblsltck() 2B4E95D168F0 ? 2B4E95FF3E70 ?
000000001 ? 000045B8A ?
7FFF177F1270 ? 000000000 ?
srsnext()+746 call stsCheckIO() 2B4E95D16FE0 ? 2B4E958F9108 ?
000000000 ? 000000001 ?
7FFF177F1270 ? 000000000 ?
srsget()+138 call srsnext() 2B4E9602FE14 ? 000000000 ?
2B4E95D16FE0 ? 2B4E958F8F10 ?
2B4E00000000 ? 000000000 ?
sorgetqbf()+297 call srsget() 2B4E95D16F28 ? 000000000 ?
000000000 ? 000000000 ?
2B4E95D372B0 ? 2B4E95D37468 ?
qersoFetch()+176 call sorgetqbf() 2B4E95D16F28 ? 2B4E95D37468 ?
2B4E95D372B0 ? 7FFF177F1584 ?
2B4E95D372B0 ? 2B4E95D37468 ?
qerliFetch()+304 call qersoFetch() 5EEF015A0 ? 002D292E4 ?
7FFF177F1748 ? 000000001 ?
5EEF01648 ? 2B4E95D37468 ?
kdicrws()+8744 call qerliFetch() 5EEF01358 ? 00143CCD6 ?
2B4E9581C140 ? 000000001 ?
5EEF01648 ? 5D2E60688 ?
kdicdrv()+335 call kdicrws() 5D2E60688 ? 5D2E60B60 ?
000000000 ? 000000001 ?
2B4E95D367B0 ? 5D2E60610 ?
opiexe()+12879 call kdicdrv() 5D2E60B60 ? 5D2E60380 ?
000000002 ? 000000001 ?
2B4E95D367B0 ? 000000000 ?
opiosq0()+3316 call opiexe() 000000004 ? 000000000 ?
7FFF177F3748 ? 000000004 ?
2B4E95D367B0 ? 000000000 ?
opiosq()+11 call opiosq0() 000000003 ? 00000000F ?
7FFF177F65E0 ? 000000000 ?
2B4E95D367B0 ? 000000000 ?
opiodr()+984 call opiosq() 000000003 ? 00000000F ?
7FFF177F65E0 ? 000000000 ?
2B4E95D367B0 ? 000000000 ?
ttcpip()+1012 call opiodr() 00000004A ? 00000000F ?
7FFF177F65E0 ? 000000004 ?
0053E3F30 ? 000000000 ?
opitsk()+1322 call ttcpip() 0060AB150 ? 7FFF177F4540 ?
7FFF177F65E0 ? 000000000 ?
7FFF177F60D8 ? 7FFF177F6748 ?
opiino()+1026 call opitsk() 000000003 ? 000000000 ?
7FFF177F65E0 ? 000000001 ?
000000000 ? 612CA0900000000 ?
opiodr()+984 call opiino() 00000003C ? 000000004 ?
7FFF177F77A8 ? 000000000 ?
000000000 ? 612CA0900000000 ?
opidrv()+547 call opiodr() 00000003C ? 000000004 ?
7FFF177F77A8 ? 000000000 ?
0053E3D00 ? 612CA0900000000 ?
sou2o()+114 call opidrv() 00000003C ? 000000004 ?
7FFF177F77A8 ? 000000000 ?
0053E3D00 ? 612CA0900000000 ?
opimai_real()+163 call sou2o() 7FFF177F7780 ? 00000003C ?
000000004 ? 7FFF177F77A8 ?
0053E3D00 ? 612CA0900000000 ?
main()+116 call opimai_real() 000000002 ? 7FFF177F7810 ?
000000004 ? 7FFF177F77A8 ?
0053E3D00 ? 612CA0900000000 ?
__libc_start_main() call main() 000000002 ? 7FFF177F7810 ?
+244 000000004 ? 7FFF177F77A8 ?
0053E3D00 ? 612CA0900000000 ?
_start()+41 call __libc_start_main() 0006D23A8 ? 000000002 ?
7FFF177F7968 ? 000000000 ?
0053E3D00 ? 000000002 ?
Looks like an hang in __read_nocancel() . Diagnostic Data for Linux: strace Output: oracle@gdksun1:~> strace -fp 2359 Process 2359 attached - interrupt to quit read(13, The process is sleeping on the file descriptor(fd) of 13 by read() system call. lsof Output: oracle@gdksun1:~> lsof -p 2359|grep 13
oracle 2359 oracle DEL REG 0,12
131074 /2
oracle 2359 oracle mem REG 8,2
133423 16839 /lib64/ld-2.4.so
oracle 2359 oracle mem REG 8,17
681761 52138 /u03/app/oracle/product/10.2.0/db_1/lib/libocr10.so
oracle 2359 oracle mem REG 8,17
691049 52139 /u03/app/oracle/product/10.2.0/db_1/lib/libocrb10.so
oracle 2359 oracle mem REG 8,17
11385162 44025 /u03/app/oracle/product/10.2.0/db_1/lib/libjox10.so
oracle 2359 oracle 6w REG 8,17
1494136 90989 /u03/app/oracle/admin/ORCL/bdump/alert_ORCL1.log
oracle 2359 oracle 13u REG 0,19
0 18446604444591769000 /dev/oracleasm/iid/0000000000000002
oracle@gdksun1:~>
The fd#13 is an ASM device. gdb output: oracle@gdksun1:~> gdb $ORACLE_HOME/bin/oracle 2359
GNU gdb 6.6
Copyright (C) 2006 Free Software Foundation, Inc.
GDB is free software, covered by the GNU General Public License, and you are
welcome to change it and/or distribute copies of it under certain conditions.
Type "show copying" to see the conditions.
There is absolutely no warranty for GDB. Type "show warranty" for details.
This GDB was configured as "x86_64-suse-linux"...
Using host libthread_db library "/lib64/libthread_db.so.1".
Attaching to program: /u03/app/oracle/product/10.2.0/db_1/bin/oracle, process 2359
Reading symbols from /u03/app/oracle/product/10.2.0/db_1/lib/libskgxp10.so...done.
Loaded symbols for /u03/app/oracle/product/10.2.0/db_1/lib/libskgxp10.so
Reading symbols from /u03/app/oracle/product/10.2.0/db_1/lib/libhasgen10.so...done.
Loaded symbols for /u03/app/oracle/product/10.2.0/db_1/lib/libhasgen10.so
Reading symbols from /u03/app/oracle/product/10.2.0/db_1/lib/libskgxn2.so...done.
Loaded symbols for /u03/app/oracle/product/10.2.0/db_1/lib/libskgxn2.so
Reading symbols from /u03/app/oracle/product/10.2.0/db_1/lib/libocr10.so...done.
Loaded symbols for /u03/app/oracle/product/10.2.0/db_1/lib/libocr10.so
Reading symbols from /u03/app/oracle/product/10.2.0/db_1/lib/libocrb10.so...done.
Loaded symbols for /u03/app/oracle/product/10.2.0/db_1/lib/libocrb10.so
Reading symbols from /u03/app/oracle/product/10.2.0/db_1/lib/libocrutl10.so...done.
Loaded symbols for /u03/app/oracle/product/10.2.0/db_1/lib/libocrutl10.so
Reading symbols from /u03/app/oracle/product/10.2.0/db_1/lib/libjox10.so...done.
Loaded symbols for /u03/app/oracle/product/10.2.0/db_1/lib/libjox10.so
Reading symbols from /u03/app/oracle/product/10.2.0/db_1/lib/libclsra10.so...done.
Loaded symbols for /u03/app/oracle/product/10.2.0/db_1/lib/libclsra10.so
Reading symbols from /u03/app/oracle/product/10.2.0/db_1/lib/libdbcfg10.so...done.
Loaded symbols for /u03/app/oracle/product/10.2.0/db_1/lib/libdbcfg10.so
Reading symbols from /u03/app/oracle/product/10.2.0/db_1/lib/libnnz10.so...done.
Loaded symbols for /u03/app/oracle/product/10.2.0/db_1/lib/libnnz10.so
Reading symbols from /usr/lib64/libaio.so.1...done.
Loaded symbols for /usr/lib64/libaio.so.1
Reading symbols from /lib64/libdl.so.2...done.
Loaded symbols for /lib64/libdl.so.2
Reading symbols from /lib64/libm.so.6...done.
Loaded symbols for /lib64/libm.so.6
Reading symbols from /lib64/libpthread.so.0...done.
[Thread debugging using libthread_db enabled]
[New Thread 47616513025792 (LWP 2359)]
Loaded symbols for /lib64/libpthread.so.0
Reading symbols from /lib64/libnsl.so.1...done.
Loaded symbols for /lib64/libnsl.so.1
Reading symbols from /lib64/libc.so.6...done.
Loaded symbols for /lib64/libc.so.6
Reading symbols from /lib64/ld-linux-x86-64.so.2...done.
Loaded symbols for /lib64/ld-linux-x86-64.so.2
Reading symbols from /usr/lib64/libnuma.so...done.
Loaded symbols for /usr/lib64/libnuma.so
Reading symbols from /opt/oracle/extapi/64/asm/orcl/1/libasm.so...done.
Loaded symbols for /opt/oracle/extapi/64/asm/orcl/1/libasm.so
0x00002b4e9512f910 in __read_nocancel () from /lib64/libpthread.so.0
(gdb)
(gdb)
(gdb)
(gdb)
(gdb)
(gdb)
(gdb)
(gdb)
(gdb)
(gdb)
(gdb)
(gdb) backtrace
#0 0x00002b4e9512f910 in __read_nocancel () from /lib64/libpthread.so.0
#1 0x00002b4e95d6772c in call_instance_read (priv=<value optimized out>, buf=0x7fff177ee970, size=80)
at asmlib_v2.c:540
#2 0x00002b4e95d67869 in asm_io_v2 (ctx=0xd, requests=<value optimized out>, reqlen=582,
waitreqs=0xffffffffffffffff, waitlen=0,
completions=0x2b4e95cce000, complen=1, timeout=4294967295, statusp=0x7fff177eea14) at asmlib_v2.c:705
#3 0x0000000000b1804d in kfkOsmIO ()
#4 0x0000000000b113e9 in kfkReapIO ()
#5 0x0000000000b0b342 in kfkIOPriv ()
#6 0x0000000000a8939f in kfdIOPriv ()
#7 0x0000000000b06eec in kfioReapIO ()
#8 0x0000000000b04de5 in kfioRequest ()
#9 0x00000000008d669a in ksfd_osmwat ()
#10 0x00000000008be64d in ksfdwtio ()
#11 0x00000000008bb3a4 in ksfdwat1 ()
#12 0x00000000008bb1f5 in ksfdrwat0 ()
#13 0x00000000008bb464 in ksfdblock ()
#14 0x00000000026c0e98 in kcflwi ()
#15 0x00000000026c0e31 in kcflci ()
#16 0x0000000001011435 in kcblci ()
#17 0x0000000001010e20 in kcblcio ()
#18 0x0000000001010ca2 in kcblsltck ()
#19 0x00000000020588f0 in stsCheckIO ()
#20 0x0000000002063908 in srsnext ()
#21 0x0000000002062eba in srsget ()
#22 0x000000000205d089 in sorgetqbf ()
#23 0x0000000002d64222 in qersoFetch ()
#24 0x0000000002d2e412 in qerliFetch ()
#25 0x00000000014327d2 in kdicrws ()
#26 0x000000000142fa47 in kdicdrv ()
#27 0x0000000002f2cf07 in opiexe ()
#28 0x00000000034c55d4 in opiosq0 ()
#29 0x00000000034c48db in opiosq ()
#30 0x00000000012e88f4 in opiodr ()
#31 0x0000000003a4b900 in ttcpip ()
#32 0x00000000012e3fc4 in opitsk ()
#33 0x00000000012e6ee4 in opiino ()
#34 0x00000000012e88f4 in opiodr ()
#35 0x00000000012da313 in opidrv ()
#36 0x0000000001e62466 in sou2o ()
#37 0x00000000006d24cb in opimai_real ()
#38 0x00000000006d241c in main ()
(gdb)
Looks like a hang in __read_nocancel() . It's the same as in Oracle stack trace. An Excerpt from /var/log/messages: Feb 2 22:46:51 gdksun1 kernel: 509 [RAIDarray.mpp]mppLnx_do_queuecommand: mppLnx_scsi_execute_async failed. At the same time, mppLnx_do_queuecommand: mppLnx_scsi_execute_async failed appeared in /var/log/messages. |
| Comments |
| Comment by ubTools Support [ 03/Feb/09 12:03 AM ] |
|
The problem caused by __read_nocancel () from /lib64/libpthread.so.0.
OS Vendor driver looks incompatible with Oracle ASMLIB. |
[QA-12] Do read()/write() system calls block users in physical IO ? Created: 15/Jul/07 Updated: 16/Sep/07 |
|
| Status: | Closed |
| Project: | Questions & Answers |
| Fix Version/s: | None |
| Type: | Oracle - Operating System | Priority: | Major |
| Reporter: | ubTools Support | Assignee: | ubTools Support |
| Resolution: | Answered | Votes: | 0 |
| Product Version: | ??? |
| Operating System: | Generic |
| Description |
|
do read()/write() system calls block users until physical IO to disk is completed ?
|
| Comments |
| Comment by ubTools Support [ 15/Jul/07 01:35 PM ] |
|
There is a common misconseption that read()/write() system calls block users until physical IO to disk is completed.
read()/write() system calls do not block users during pyhsical IO unless file is opened with O_DIRECT or O_SYNC flags. Users are blocked just during copying buffers from/to user address space to/from kernel address space. So, although read()/write() calls look synchronous in user perspective, they don't do physical IO as synchronously. In Asynchronous IO calls(i.e aio_read()/aio_write()), users are just blocked during enqueuing IO requests, not during copying buffers from/to user address space to/from kernel address space and not during physical IO. |