|
|
History
| Log In
|
|
|
|
[
Permlink
| « Hide
]
ubTools Support - 29/Sep/15 12:16 PM
See the following notes for the basic definitions of CPUfreq Governors:
ENVIRONMENT:
Data: [perftest1]/sys/devices/system/cpu/cpu0/cpufreq $ more * :::::::::::::: affected_cpus :::::::::::::: 0 cpuinfo_cur_freq: Permission denied :::::::::::::: cpuinfo_max_freq :::::::::::::: 2000000 :::::::::::::: cpuinfo_min_freq :::::::::::::: 1200000 :::::::::::::: cpuinfo_transition_latency :::::::::::::: 10000 *** ondemand: directory *** :::::::::::::: related_cpus :::::::::::::: 0 :::::::::::::: scaling_available_frequencies :::::::::::::: 2000000 1900000 1800000 1700000 1600000 1500000 1400000 1300000 1200000 :::::::::::::: scaling_available_governors :::::::::::::: ondemand userspace performance :::::::::::::: scaling_cur_freq :::::::::::::: 2000000 :::::::::::::: scaling_driver :::::::::::::: acpi-cpufreq :::::::::::::: scaling_governor :::::::::::::: ondemand :::::::::::::: scaling_max_freq :::::::::::::: 2000000 :::::::::::::: scaling_min_freq :::::::::::::: 1200000 :::::::::::::: scaling_setspeed :::::::::::::: <unsupported> *** stats: directory *** [perftest1]/sys/devices/system/cpu/cpu0/cpufreq $ cd ondemand [perftest1]/sys/devices/system/cpu/cpu0/cpufreq/ondemand $ ls -ltr total 0 -r--r--r-- 1 root root 4096 Sep 29 15:17 sampling_rate_min -r--r--r-- 1 root root 4096 Sep 29 15:17 sampling_rate_max -rw-r--r-- 1 root root 4096 Sep 29 15:17 up_threshold -rw-r--r-- 1 root root 4096 Sep 29 15:17 sampling_rate -rw-r--r-- 1 root root 4096 Sep 29 15:17 powersave_bias -rw-r--r-- 1 root root 4096 Sep 29 15:17 ignore_nice_load [perftest1]/sys/devices/system/cpu/cpu0/cpufreq/ondemand $ more * :::::::::::::: ignore_nice_load :::::::::::::: 0 :::::::::::::: powersave_bias :::::::::::::: 0 :::::::::::::: sampling_rate :::::::::::::: 10000 :::::::::::::: sampling_rate_max :::::::::::::: 4294967295 :::::::::::::: sampling_rate_min :::::::::::::: 10000 :::::::::::::: up_threshold :::::::::::::: 95 [perftest1]/sys/devices/system/cpu/cpu0/cpufreq/ondemand $ View:
atop(http://www.atoptool.nl/
From the man page of atop: In case that the kernel module 'cpufreq_stats' is active (after issueing 'modprobe cpufreq_stats'), the average frequency ('avgf')
and the average scaling percentage ('avgscal') is shown. Otherwise the current frequency ('curf') and the current scaling percentage
('curscal') is shown at the moment that the sample is taken.
In order to compare the CPU usages to the frequencies, CPU "cpufreq_stats" should be enabled. Otherwise, atop will show the current frequencies, not the average during monitoring samples. METHOD:
TEST1:
CPU scaling governor is ondemand. An atop snapshot: ATOP - avsprddbflx05 2015/09/29 15:40:21 --------- 10s elapsed PRC | sys 7.86s | user 80.03s | #proc 1347 | #tslpi 1791 | #tslpu 0 | #zombie 0 | no procacct | CPU | sys 66% | user 800% | irq 13% | idle 626% | wait 95% | avgf 1.63GHz | avgscal 81% | cpu | sys 4% | user 86% | irq 1% | idle 6% | cpu000 w 3% | avgf 1.94GHz | avgscal 96% | cpu | sys 4% | user 77% | irq 5% | idle 11% | cpu004 w 3% | avgf 1.90GHz | avgscal 94% | cpu | sys 4% | user 72% | irq 0% | idle 17% | cpu001 w 7% | avgf 1.83GHz | avgscal 91% | cpu | sys 3% | user 67% | irq 0% | idle 20% | cpu002 w 9% | avgf 1.80GHz | avgscal 90% | cpu | sys 3% | user 61% | irq 0% | idle 28% | cpu003 w 8% | avgf 1.73GHz | avgscal 86% | cpu | sys 6% | user 54% | irq 1% | idle 34% | cpu009 w 6% | avgf 1.62GHz | avgscal 80% | cpu | sys 3% | user 52% | irq 1% | idle 36% | cpu005 w 8% | avgf 1.68GHz | avgscal 83% | cpu | sys 7% | user 47% | irq 1% | idle 29% | cpu008 w 16% | avgf 1.67GHz | avgscal 83% | cpu | sys 6% | user 45% | irq 0% | idle 48% | cpu013 w 1% | avgf 1.52GHz | avgscal 76% | cpu | sys 7% | user 39% | irq 1% | idle 53% | cpu015 w 1% | avgf 1.49GHz | avgscal 74% | cpu | sys 3% | user 41% | irq 0% | idle 49% | cpu006 w 7% | avgf 1.57GHz | avgscal 78% | cpu | sys 5% | user 34% | irq 0% | idle 52% | cpu010 w 9% | avgf 1.51GHz | avgscal 75% | cpu | sys 2% | user 35% | irq 1% | idle 55% | cpu007 w 7% | avgf 1.55GHz | avgscal 77% | cpu | sys 4% | user 32% | irq 0% | idle 63% | cpu014 w 1% | avgf 1.43GHz | avgscal 71% | cpu | sys 4% | user 31% | irq 0% | idle 59% | cpu011 w 6% | avgf 1.46GHz | avgscal 72% | cpu | sys 2% | user 26% | irq 0% | idle 68% | cpu012 w 3% | avgf 1.43GHz | avgscal 71% | CPL | avg1 5.33 | avg5 5.46 | avg15 4.57 | csw 377039 | intr 323539 | | numcpu 16 | MEM | tot 126.1G | free 38.8G | cache 3.6G | dirty 4.0M | buff 146.3M | slab 577.8M | | SWP | tot 17.1G | free 17.1G | | | | vmcom 12.9G | vmlim 42.6G | NET | transport | tcpi 20869 | tcpo 21016 | udpi 70875 | udpo 71067 | tcpao 33 | tcppo 1 | NET | network | ipi 128214 | ipo 92084 | ipfrw 0 | deliv 91742 | icmpi 0 | icmpo 0 | PID TID SYSCPU USRCPU VGROW RGROW RUID EUID THR ST EXC S CPU CMD 1/64 13661 - 0.15s 4.50s -24.0M -14.3M grid oracle 1 -- - R 47% oracle 15747 - 0.16s 3.80s 0K 684K grid oracle 1 -- - S 40% oracle 13733 - 0.32s 3.57s 32768K 31360K grid oracle 1 -- - R 39% oracle 27274 - 0.61s 3.21s 24576K 11976K grid oracle 1 -- - R 39% oracle 14869 - 0.17s 3.29s 0K -1880K grid oracle 1 -- - S 35% oracle The "CPU" shows overall statistics for all CPUs. Analysis:
TEST2:
CPU scaling governor is performance. An atop snapshot: ATOP - avsprddbflx05 2015/09/29 16:16:27 --------- 10s elapsed PRC | sys 7.06s | user 86.40s | #proc 1313 | #tslpi 1756 | #tslpu 0 | #zombie 0 | no procacct | CPU | sys 57% | user 864% | irq 14% | idle 623% | wait 43% | avgf 2.00GHz | avgscal 100% | cpu | sys 3% | user 80% | irq 7% | idle 10% | cpu004 w 1% | avgf 2.00GHz | avgscal 100% | cpu | sys 5% | user 81% | irq 2% | idle 11% | cpu000 w 2% | avgf 2.00GHz | avgscal 100% | cpu | sys 3% | user 82% | irq 1% | idle 14% | cpu001 w 1% | avgf 2.00GHz | avgscal 100% | cpu | sys 3% | user 74% | irq 0% | idle 21% | cpu002 w 2% | avgf 2.00GHz | avgscal 100% | cpu | sys 3% | user 73% | irq 0% | idle 22% | cpu003 w 2% | avgf 2.00GHz | avgscal 100% | cpu | sys 3% | user 62% | irq 0% | idle 32% | cpu005 w 3% | avgf 2.00GHz | avgscal 100% | cpu | sys 6% | user 58% | irq 1% | idle 26% | cpu008 w 10% | avgf 2.00GHz | avgscal 100% | cpu | sys 3% | user 51% | irq 0% | idle 43% | cpu006 w 2% | avgf 2.00GHz | avgscal 100% | cpu | sys 3% | user 47% | irq 0% | idle 47% | cpu010 w 3% | avgf 2.00GHz | avgscal 100% | cpu | sys 3% | user 46% | irq 0% | idle 49% | cpu013 w 2% | avgf 2.00GHz | avgscal 100% | cpu | sys 2% | user 44% | irq 1% | idle 50% | cpu007 w 3% | avgf 2.00GHz | avgscal 100% | cpu | sys 6% | user 40% | irq 1% | idle 48% | cpu009 w 6% | avgf 2.00GHz | avgscal 100% | cpu | sys 6% | user 33% | irq 1% | idle 57% | cpu011 w 3% | avgf 2.00GHz | avgscal 100% | cpu | sys 2% | user 34% | irq 0% | idle 60% | cpu012 w 3% | avgf 2.00GHz | avgscal 100% | cpu | sys 4% | user 28% | irq 0% | idle 66% | cpu014 w 2% | avgf 2.00GHz | avgscal 100% | cpu | sys 2% | user 28% | irq 0% | idle 69% | cpu015 w 1% | avgf 2.00GHz | avgscal 100% | CPL | avg1 5.98 | avg5 6.41 | avg15 4.75 | csw 382133 | intr 340254 | | numcpu 16 | MEM | tot 126.1G | free 36.6G | cache 5.3G | dirty 28.9M | buff 193.0M | slab 836.2M | | SWP | tot 17.1G | free 17.1G | | | | vmcom 13.0G | vmlim 42.6G | NET | transport | tcpi 10272 | tcpo 10302 | udpi 75222 | udpo 75458 | tcpao 30 | tcppo 2 | NET | network | ipi 111030 | ipo 85760 | ipfrw 0 | deliv 85494 | icmpi 0 | icmpo 0 | PID TID SYSCPU USRCPU VGROW RGROW RUID EUID THR ST EXC S CPU CMD 1/62 15847 - 0.17s 4.59s 0K 896K grid oracle 1 -- - S 48% oracle 14867 - 0.14s 3.79s 0K 2220K grid oracle 1 -- - R 40% oracle 15835 - 0.15s 3.76s 8192K 384K grid oracle 1 -- - R 39% oracle 14871 - 0.24s 3.59s 0K 0K grid oracle 1 -- - R 39% oracle 15849 - 0.14s 3.55s 0K -1216K grid oracle 1 -- - R 37% oracle Analysis:
COMPARISION:
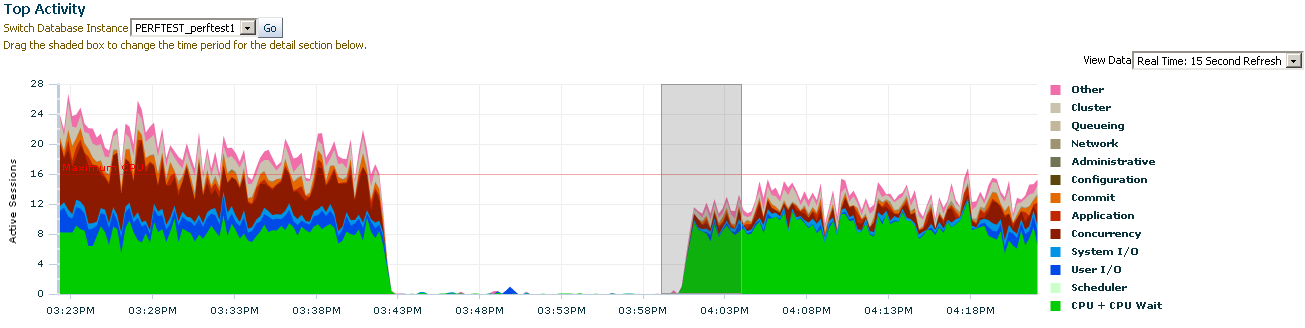
30 minutes load test results... 1st: When CPU scaling governor is ondemand. Data: Top Activity:
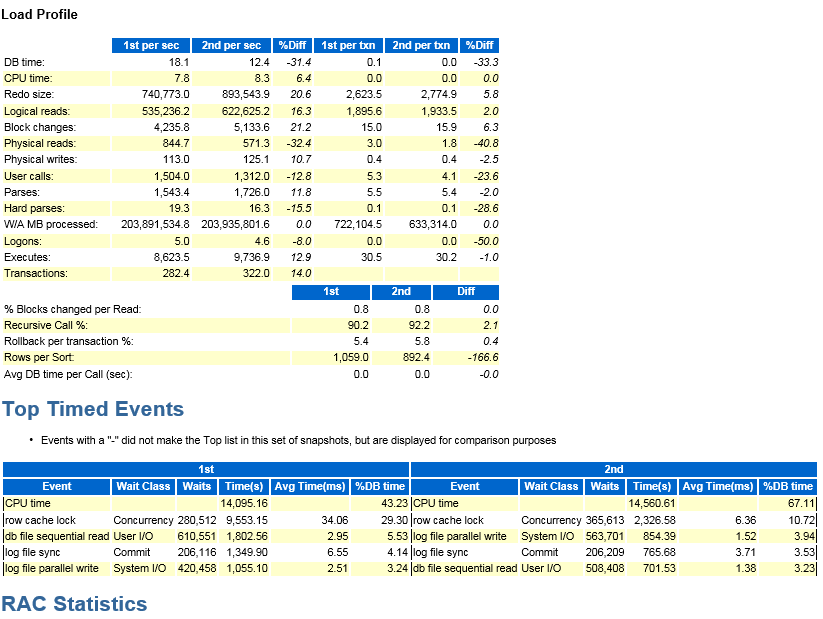
AWR:
Analysis:
SUMMARY:
Analysis:
Recommendations:
CPU TIME and LOGICAL READS:
Data:
Analysis: 8.9% improvements in CPU time caused 31.4% improvement DB time.
The focus here is to show how CPU scaling governor affects Oracle service and wait times; not to show how to tune Oracle events such as "row cache lock" above.
|
||||||||||||||||||||||||||||||||||||||||||||||||||||||||||||||||||||||||||||||||||||||||||||||||||||||||||||||||||||||